Science:Math Exam Resources/Courses/MATH103/April 2017/Question 01 (e) (i)
{{#incat:MER QGQ flag|{{#incat:MER QGH flag|{{#incat:MER QGS flag|}}}}}}
• Q1 (a) • Q1 (b) • Q1 (c) • Q1 (d) • Q1 (e) (i) • Q1 (e) (ii) • Q1 (e) (iii) • Q1 (f) • Q2 (a) • Q2 (b) (i) • Q2 (b) (ii) • Q2 (c) • Q3 (a) • Q3 (b) • Q3 (c) • Q3 (d) • Q4 • Q5 • Q6 (a) • Q6 (b) • Q7 (a) • Q7 (b) • Q7 (c) • Q8 (a) • Q8 (b) • Q8 (c) • Q9 (a) • Q9 (b) • Q9 (c) • Q9 (d) • Q9 (e) •
Question 01 (e) (i) |
|---|
|
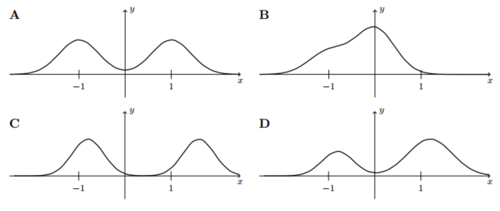
Plots (A-D) depict probability density functions, pdf ’s, for at the same scale. List all pdf ’s that satisfy the following criteria: ( denotes the mean and the median) (i) ? |
|
Make sure you understand the problem fully: What is the question asking you to do? Are there specific conditions or constraints that you should take note of? How will you know if your answer is correct from your work only? Can you rephrase the question in your own words in a way that makes sense to you? |
|
If you are stuck, check the hint below. Consider it for a while. Does it give you a new idea on how to approach the problem? If so, try it! |
Hint |
|---|
|
First we need to clear the two definitions of mean and median for pdf. The mean or average value of (also called the expected value) in the interval , denoted is given by
|
|
Checking a solution serves two purposes: helping you if, after having used the hint, you still are stuck on the problem; or if you have solved the problem and would like to check your work.
|
Solution |
|---|
|
The median simply indicates a place at which the “total mass” is subdivided into two equal portions. (In the case of probability density, each of those portions represents an equal area, since the total area under the graph is 1 by definition.) Simply put, the mean contains more information about the way that the distribution is arranged spatially. This stems from the fact that the mean of the distribution is a “sum” - i.e. integral of terms of the form . Thus the location along the x axis, x, not just the “mass”, , affects the contribution of parts of the distribution to the value of the mean; moving one half of a distribution away from the median will change its mean but not its median.
As for B, the mean will on the left side of median: the point that separates the area into two equal parts will on the left side of y-axis, while the mean will be even further left because it is the integral of terms of the form . It is not only dragged by like the median, but also by . In other words, the ``tail" of the distribution is larger on the left side than on the right side. As for D, like above, just now opposite direction, the mean will be on the right side of the median. answer: |
{{#incat:MER CT flag||
}}


![{\displaystyle [a,b]}](https://wiki.ubc.ca/api/rest_v1/media/math/render/svg/9c4b788fc5c637e26ee98b45f89a5c08c85f7935)


