Science:Math Exam Resources/Courses/MATH102/December 2011/Question 04 (vi)
{{#incat:MER QGQ flag|{{#incat:MER QGH flag|{{#incat:MER QGS flag|}}}}}}
• Q1 (a) i • Q1 (a) ii • Q1 (b) i • Q1 (b) ii • Q1 (b) iii • Q1 (c) • Q2 (a) i • Q2 (a) ii • Q2 (a) iii • Q2 (b) i • Q2 (b) ii • Q2 (b) iii • Q2 (c) • Q3 • Q4 (i) • Q4 (ii) • Q4 (iii) • Q4 (iv) • Q4 (v) • Q4 (vi) • Q5 • Q6 • Q7 (i) • Q7 (ii) • Q7 (iii) • Q8 (i) • Q8 (ii) • Q8 (iii) • Q9 •
Question 04 (vi) |
|---|
|
Consider the function vi) Provide a qualitatively accurate sketch of f(x). Make sure your graph reflects the information above. |
|
Make sure you understand the problem fully: What is the question asking you to do? Are there specific conditions or constraints that you should take note of? How will you know if your answer is correct from your work only? Can you rephrase the question in your own words in a way that makes sense to you? |
|
If you are stuck, check the hint below. Consider it for a while. Does it give you a new idea on how to approach the problem? If so, try it! |
Hint |
|---|
|
The previous questions have given you all the information you need to be able to transfer all that algebraic information into something geometric (the sketch of the graph). Ask yourself:
Whatever you sketch, check whether your drawing matches the information you collected. |
|
Checking a solution serves two purposes: helping you if, after having used the hint, you still are stuck on the problem; or if you have solved the problem and would like to check your work.
|
Solution |
|---|
|
This function is a polynomial of degree 4, so the curve sketching shouldn't offer too many difficulties. We have collected the following information:
To get a better idea of what to sketch, we quickly compute the second coordinates of the three points of interests:
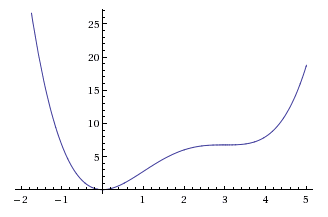
This allows us to sketch the graph of this function. As we saw above, this function is always positive, reaches a global minimum at the point (0,0) and has two inflection points. This should give you a picture that looks like: |
{{#incat:MER CT flag||
}}


