Science:Math Exam Resources/Courses/MATH102/December 2015/Question 18 (d)
{{#incat:MER QGQ flag|{{#incat:MER QGH flag|{{#incat:MER QGS flag|}}}}}}
• Q1 • Q2 • Q3 • Q4 • Q5 • Q6 • Q7 • Q8 • Q9 • Q10 (a) • Q10 (b) • Q11 • Q12 • Q13 • Q14 (a) • Q14 (b) • Q15 • Q16 • Q17 • Q18 (a) • Q18 (b) • Q18 (c) • Q18 (d) • Q19 (a) • Q19 (b) • Q19 (c) • Q19 (d) • Q19 (e) •
Question 18 (d) |
|---|
|
A dangerous infectious disease spreads through Vancouver as described by the differential equation
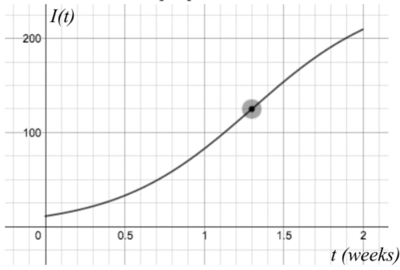
where is the transmission rate constant, is the total population size (constant), is the recovery rate and is the number of infected individuals. Assume that . (d) By collecting data from local hospitals, you manage to plot the graph of number of infected individuals as a function of time from the onset of the epidemic until two weeks later. You notice an inflection point in the data and mark it with a black dot. What is the steady state number of infected people? Your answer should be a number. |
|
Make sure you understand the problem fully: What is the question asking you to do? Are there specific conditions or constraints that you should take note of? How will you know if your answer is correct from your work only? Can you rephrase the question in your own words in a way that makes sense to you? |
|
If you are stuck, check the hint below. Consider it for a while. Does it give you a new idea on how to approach the problem? If so, try it! |
Hint |
|---|
|
Observe how is changing from the given graph. |
|
Checking a solution serves two purposes: helping you if, after having used the hint, you still are stuck on the problem; or if you have solved the problem and would like to check your work.
|
Solution |
|---|
|
From the given graph, we can observe that (the slope at each points on the graph) is increasing up to the black dot, and after that, it starts to decrease. This implies that at the black dot, becomes largest. In part (b), the value of at which is largest is . Therefore the second component (the value of ) of the black dot is . In other words, and hence the steady state is . |
{{#incat:MER CT flag||
}}


