Science:Math Exam Resources/Courses/MATH100/December 2011/Question 05 (e)
{{#incat:MER QGQ flag|{{#incat:MER QGH flag|{{#incat:MER QGS flag|}}}}}}
• Q1 (a) • Q1 (b) • Q1 (c) • Q1 (d) • Q1 (e) • Q1 (f) • Q1 (g) • Q1 (h) • Q1 (i) • Q1 (j) • Q1 (k) • Q1 (l) • Q1 (m) • Q1 (n) • Q2 (a) • Q2 (b) • Q3 (a) • Q3 (b) • Q4 (a) • Q4 (b) • Q5 (a) • Q5 (b) • Q5 (c) • Q5 (d) • Q5 (e) • Q6 • Q7 • Q8 •
Question 05 (e) |
|---|
|
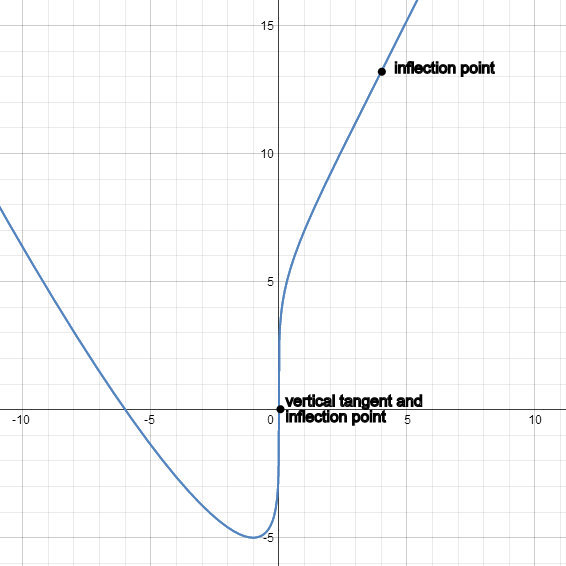
Full-Solution Problems. In questions 2-8, justify your answers and show all your work. Simplification of answers is not required unless explicitly stated. Let Sketch the graph of and indicate the inflection points on your graph. Please also indicate the point(s) on your graph at which the graph of has a vertical tangent line. |
|
Make sure you understand the problem fully: What is the question asking you to do? Are there specific conditions or constraints that you should take note of? How will you know if your answer is correct from your work only? Can you rephrase the question in your own words in a way that makes sense to you? |
|
If you are stuck, check the hint below. Consider it for a while. Does it give you a new idea on how to approach the problem? If so, try it! |
Hint |
|---|
|
A vertical tangent line means that the derivative is undefined at the point. As for the sketch, use the previous parts of this question to help with your drawing. |
|
Checking a solution serves two purposes: helping you if, after having used the hint, you still are stuck on the problem; or if you have solved the problem and would like to check your work.
|
Solution |
|---|
|
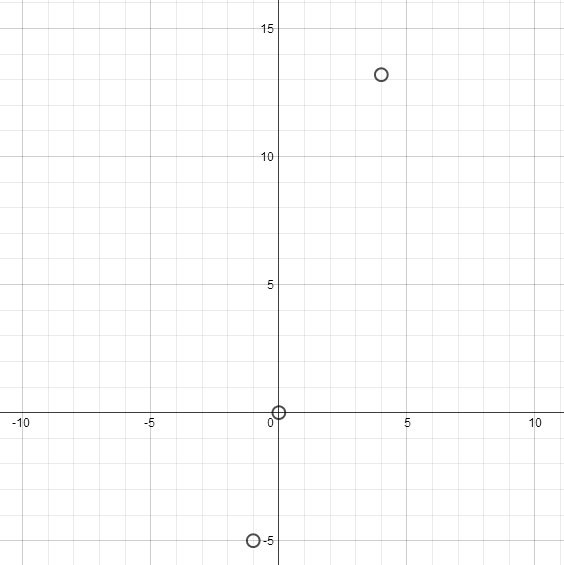
From parts (a) and (d), we know that the critical values for the first and second derivative of are , and . We first calculate the corresponding y-values for the x-values named above ...
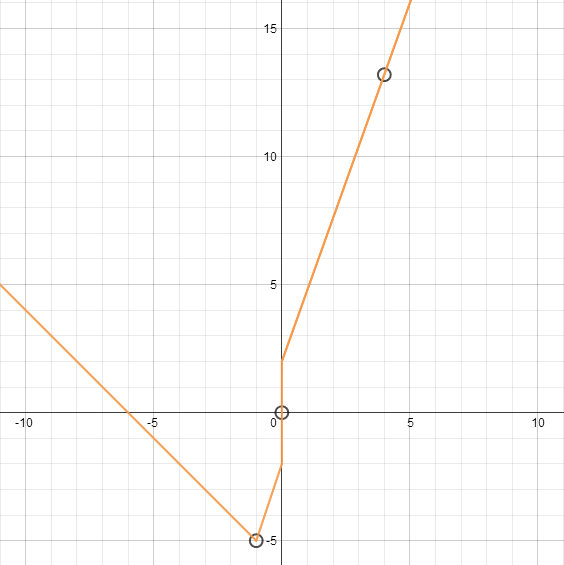
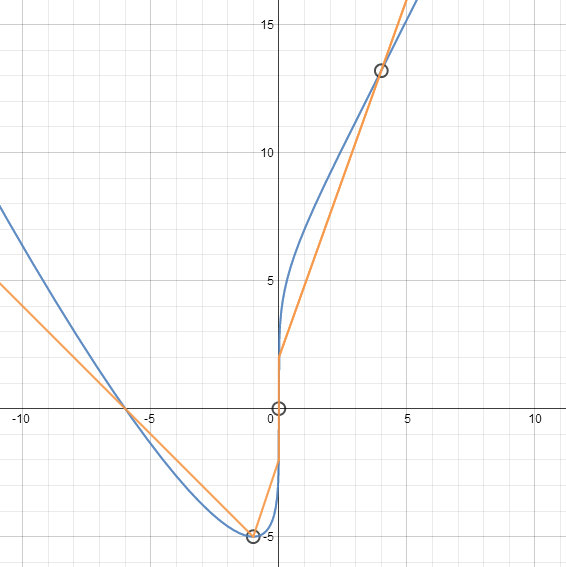
...and then plot these points on the graph. From part (b), we know the function is decreasing until the point and then increasing. Thus the function has a minimum at that point. Because the derivative is undefined at , it has a vertical tangent line there. Schematically, the tangent lines and increase/decrease of the function looks like this. However, we know the function isn't made up of straight lines - it's more curvy than that. From part (d) we know that the function has an inflection point at and . Furthermore we know that the function is concave up for and and is concave down for . This tells us what our curves should look like. If we superimpose the curve on top of the straight lines it looks something like this: So the final graph should look like this: |
{{#incat:MER CT flag||
}}


