Documentation:Wordpress/Plugins/Evaluate
| UBC CMS Codex | |
|---|---|
| Welcome to the support documentation for the UBC CMS Service. | |
| Contents | |
| UBC Collab Theme | |
|
UBC Collab Theme Overview | |
Evaluate adds options for user interaction to your site. You can create metrics for users or admins to rate content on your site. Such as Likes, Up/Down Votes, 5-Star ratings and polls.
Setup
- From the Dashboard, select Tools -> Plugins, then scroll down to Evaluate and click the activate link on the right.
- A menu item called Metrics should appear in the left sidebar.
- If you wish to use NodeJS for live metric updating, install the Stream plugin.
Usage
Metrics are what Evaluate uses to keep track of votes for content on your site (like posts, pages, or any public custom post type). These can be questions like "Was this article helpful?", or be untitled.
Metrics are usually associated with more than one piece of content. They are displayed in order after the main post content.
Configuration

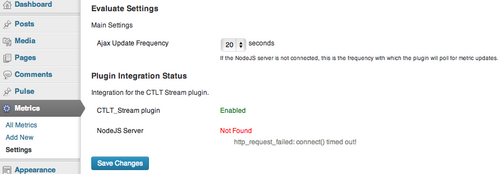
Miscellaneous settings for the plugin can be found at Metrics -> Settings. Here you can view information about Evaluate's integration with other plugins, such as the Stream plugin, and also control the ajax update frequency.
Ajax update frequency is only valid if the "Node Server" does not indicate "Connected". This number indicates how many seconds the page will update before refreshing the metrics that are shown on the page. By default, this means that every 20 seconds the web page will send a request back to your server asking if there have been any changes to the votes, and update what is displayed on the screen if necessary. If a Node Server is connected, these updates will happen immediately.
Network Administrators

This section is only relevant to Network Administrators, most people will not need to worry about it.
Network administrators are able to control the range of available Ajax update frequencies. Using low numbers in your ajax update interval can put serious strain on the server, especially if you have a large number of concurrent users. Therefore network administrators can tweak the available options to match the power of their servers.
Configure this by going to Network Admin dashboard. Go to Plugins and "Network Activate" the Evaluate plugin, this will make Evaluate's network settings available under Settings -> Evaluate.
When a site administrator chooses their Ajax Update Frequency, their choice is stored as an index in the list of available options, rather than the actual value. For example, by default, the available options 10,15,20,30,60, and the default setting is 20, therefore each site will store the number 3 as their option. The result of this means that, as a Network Administrator, if you change the available options, all your sites will change to follow suit. For example, if you change the available options to 20,40,60,120,300, the default site will now have it's frequency set to 60. This will allow you to easily adjust the frequency globally if your server situation changes. So don't be afraid to tweak this option as you see fit!
Managing Metrics
Creating a Metric

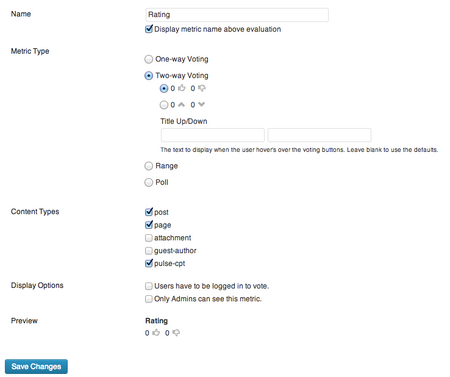
Go to Metrics -> Add New. Here you will be presented with a variety of options to configure and customize your new metric.

Each Metric Type, creates a different style of rating.
- A one-way rating presents a simple up vote to the user. This is useful as a Favourite, or Endorse button. You can choose from a variety of different symbols for the metric (thumb, arrow, heart, star, or a bookmark), and customize the text that is displayed next to that symbol. Leaving the "Title" field blank will use the default title, but you can insert a space character to hide the title all together.
- A two-way metric provides a classic up or down choices, like the ones provided on many sites, such as YouTube, or Urban Dictionary. You can use either a pair of thumbs, or two arrows to represent this metric.
- A range rating will display a row of stars, and allow the user to choose X out of 5 stars. The number of stars defaults to 5, but can be customized to anything from 3 - 10.
- A poll allows you to ask the user a question about the post. For feedback that is more complex than a simple positive/negative. You can add any number of possible answers to a poll.
Content Type determines which types of posts/pages/etc. this metric will be displayed on by default. Usually this will just show the "post", and "page" option, but any custom content types added by other plugins - such as Profile CCT, or Pulse CPT - will also show up in this list. Metrics can also be hidden on individual posts, details about that are further down this page.
Editing a Metric
To edit a metric, navigate to Metrics -> All Metrics. This page displays a list of all metrics, from which you can delete, or modify existing metrics. Find your metric in the list and hover over it to reveal the "Edit" link.
Note that if any votes have been registered for the metric in question, you will be unable to edit the "Metric Type", or the length parameter for range metrics. Changing this option would corrupt the existing voting data, so it is disabled.
Hiding a Metric on a Single Post
When creating or editing a post you will find a widget called "Evaluate" in the right sidebar, usually near the bottom. You can use this widget to remove specific metrics from the post you are editing.
Metric Results

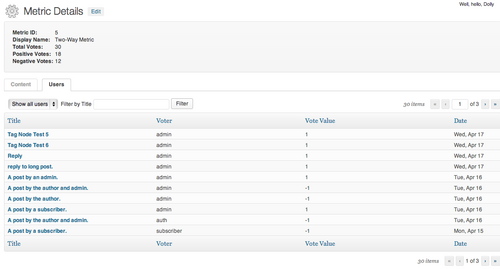
You can view a detailed report of the votes made on each metric. Go to Metrics -> All Metrics. Find the metric you are interested in, in the list, and hover over it to reveal the "View Details" link. This will take you to the detailed voting information. On this page it shows a selection of overall stats at the top of the page, and has two different views below, "Content", and "Users".
The content tab shows each piece of content that has any votes on it, and shows the calculated score for that piece of content (See Scoring below). For Polls, however, it instead shows the most popular choice. This list can be filtered to only show content for a certain content type, author, category, or month.
On the users tab it shows a list of each individual vote, alongside the user who made the vote, and the name of the content the vote was recorded for. You can filter this view by the voter, or content title to get a breakdown of votes on a particular content type, or votes made by a particular user.
Scoring
The evaluate uses a somewhat non-standard method for scoring the results of each metric. A simple ratio of positive votes out of total votes, or positive minus negative votes can often have misleading results, especially when comparing metrics with few votes to those with many. You can read How Not To Sort By Average Rating by Evan Miller, for more details on why we chose to use an alternate scoring method for Two-Way and Range metrics.
One-Way metrics are given a simple score equal to the number of votes it received. Polls are expressed with the percentage of votes that went to each answer.
Two Way Metric
The score for two-way metrics is calculated by taking the lower bound of the Wilson Score interval. This is a method for calculating the "true" proportion of positive to negative scores. The topic is somewhat complex, you can read this wikipedia article for details. Simply put, the wilson score calculates a range of possible scores, with a 95% chance of including a the "true" proportion of positive to negative scores. To us, it is only important to know the relative scores between each rating, rather than the actual value itself, so we take the lowest value of this range, and store it as the content's score.
Range Metric
These metrics are scored using a simple Bayesian Estimate. We assume that, typically, ratings should tend towards 50%. The formula will take this natural average of 50% and incorporate it into the calculation, allowing us to compensate for a low quantity of votes, or bring a large deviation from the norm into context.
Sorting
You can add the arguments ?evaluate=sort&sort=<sort_type>&metric_id=<metric_id> to the url of any page that displays content, in order to sort that content by one of it's metric scores.
<metric_id> should be replaced by the id of the metric you want to sort by. You can see the metric ID on each metric's details page (See "Metric Results" above). <sort_type> can be one of
- score, the calculated score for each post. Undefined behaviour for poll metric types.
- total_votes, the total number of votes that have been made on each post, for this metric.
- user_vote, only shows posts that the user has voted on.
- controversy, a simple score which represents how divisive the votes on each post have been.
Adding &order=<asc|desc> will determine the order.
For example, http://localhost/?evaluate=sort&sort=score&metric_id=1&order=asc, will display the posts on my main page, with the most unpopular posts (determined by metric #1) at the top of the list.
Live Updating
The Evaluate plugin supports a live updating feature for metrics, using either NodeJS or Ajax. This means that while viewing a page with metrics being displayed on it, those metrics will have their values updates as other users vote on the metric. You would be able to view a page you just posted and see the feedback coming in live.
Using NodeJS is preferable, as it put less strain on the servers, and provides near instantaneous updating. Therefore NodeJS will be used automatically if you have the Stream plugin installed, and configured.
If Evaluate cannot reach a node server, it will resort to using Ajax. This means that at a set interval (Which can be configured in the Evaluate settings), users will send a request back to the server, asking if there have been any new votes, and updating their display if appropriate.
Use Cases

Below are several different scenarios in which this plugin might be used.
Pulse CPT Integration
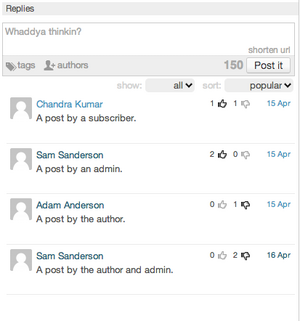
This plugin integrates with Pulse CPT. The Pulse plugin creates a widget of live updating comments across your site, and can optionally add a metric created by Evaluate to it's pulse-list view (With the exception of polls). The result is a sleek list of content which can be easily rated by users, similar to Facebook or YouTube.
Pulse CPT also takes advantage of Evaluate's sorting functionality. At the top of each pulse list there are two dropdown menus that allow the user to filter the pulses being shown on the page being viewed. You can sort by Popularity or Controversy, and likewise, you can filter the list to only show pulses that you have voted on.
Bookmarking
Evaluate's rating system can also be effectively used for bookmarking content. Simply configure a one-way metric with your desired style and a title indicating that its purpose. When users "vote" on this metric, it will act just like any other one-way metric. However, using Evaluate's sorting functionality you can create a page which will only display posts (or your favourite custom post type) that they have bookmarked.
Go to the details view for your new bookmark metric, and get the metric ID from the top of that page. Next, go to the front page of your site (or any page that displays a list of all the posts that you want to bookmark-able), and add these parameters to the end of the url: ?evaluate=sort&sort=user_vote&metric_id=<metric_id>, where <metric_id> is the ID that you found on the detail page.
Then simply provide a link this new url, and any user that visits that page will see a list of the posts that they bookmarked.
Instructor Marking
When creating or editing a metric, one of the available options is "Only Admins can see this metric". The idea behind this option is to allow administrators to privately grade posts on a site that allows it's users to upload content.
For example, on a course website, the instructor or students might post papers or other course work submitted by the students. The site administrator (instructor), could then create a simple private marking rubric using one or more of the metrics, along side a public rating system, to allow the student's peers to rate the work.
After collecting feedback and marking the content, the instructor could then view a list of the results on the metrics' detailed view.
Support Feedback
Many support sites (e.g. Apple Support) ask the question "Was this Helpful?" at the bottom of each page. This is a simple question that is relevant to each page, and easily created with the Evaluate plugin. Simply create a new two-way metric (or a poll if you prefer), give it the title "Was this Helpful?", and make sure you tick off the "Display metric name above evaluation" checkbox.
Once people start voting it will become easy to identify good and sub-par articles in the metric's details view.
Reddit-style Site
Using Evaluate and it's sorting functionality, one can create a site in the style of reddit, or other popularity based news sites. Create a one-way, two-way, or range metric, and add it to your posts.
Go to the details view for your new bookmark metric, and get the metric ID from the top of that page. Next, go to the front page of your site (or any page that displays a list of all the posts that you want to bookmark-able), and add these parameters to the end of the url: ?evaluate=sort&sort=score&metric_id=<metric_id>, where <metric_id> is the ID that you found on the detail page.
That url will now display a list of the most popular posts on your site.