Science:Math Exam Resources/Courses/MATH103/April 2011/Question 03 (a)
{{#incat:MER QGQ flag|{{#incat:MER QGH flag|{{#incat:MER QGS flag|}}}}}}
• Q1 (a) • Q1 (b) • Q1 (c) • Q2 (a) • Q2 (b) • Q2 (c) • Q2 (d) • Q3 (a) • Q3 (b) • Q4 (a) • Q4 (b) • Q5 (a) • Q5 (b) • Q5 (c) • Q5 (d) • Q6 (a) • Q6 (b) • Q7 (a) • Q7 (b) • Q7 (c) • Q8 •
Question 03 (a) |
|---|
|
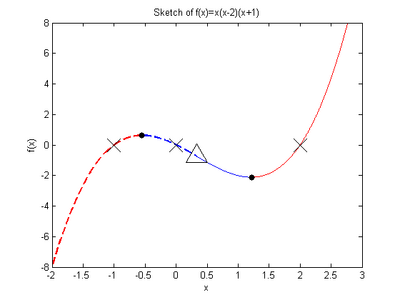
Consider the function . Sketch the function. |
|
Make sure you understand the problem fully: What is the question asking you to do? Are there specific conditions or constraints that you should take note of? How will you know if your answer is correct from your work only? Can you rephrase the question in your own words in a way that makes sense to you? |
|
If you are stuck, check the hint below. Consider it for a while. Does it give you a new idea on how to approach the problem? If so, try it! |
Hint |
|---|
|
What are the roots of ? What happens to when ? In which intervals is positive, in which is the function negative? Find any local maxima and local minima. |
|
Checking a solution serves two purposes: helping you if, after having used the hint, you still are stuck on the problem; or if you have solved the problem and would like to check your work.
|
Solution | |||||||||||||||||||||
|---|---|---|---|---|---|---|---|---|---|---|---|---|---|---|---|---|---|---|---|---|---|
|
We will preface this question by noting that the original intent in the exam was to understand the sketch well enough to proceed to part (b). However, we have decided to present the solution as detailed as possible for those who would like to improve their curve sketching techniques. Now we will complete this question by following a checklist that is fairly standard for these types of problems.
1: Find roots: Luckily we have a polynomial that is already written in factored form so we can read, as the roots, the factors. Therefore if then the roots are at , , . 2: Asymptotes: Now polynomials are continuous everywhere (their domain is all the real numbers) and so we do not expect any vertical asymptotes. When looking for horizontal asymptotes we typically take the limit as goes to . We don't need to be so formal here because it's clear that as gets large then also gets large as their is nothing (such as a denominator) to slow its growth. What's to be determined is whether gets large and positive or large and negative. If we were to put a very large positive value of into we would get that since adding or subtracting numbers to something large is unaffected. Now as goes to then will go to as well. If we put in a large negative number, once again adding or subtracting small numbers will have no affect and once again, which approaches as goes to . Therefore, 3. Critical Points: In order to find critical points we first need the derivative. In order to do this we need to apply the product rule three times. Therefore, Critical points will occur when . Therefore, are our critical points. 4. Intervals of Increase and Decrease and Local Max/Min: We have that our derivative is, with critical points To find intervals of increasing and decreasing we look at the derivative between each critical point over the entire domain. If the derivative is positive then the function is increasing and if the derivative is negative, the function is decreasing.
From the table we see that the critical point is a local maximum since the derivative is increasing on the left and decreasing on the right. By a similar logic we have that the other critical point is a local minimum. 5. Intervals of Concavity and Points of Inflection: In order to determine points of inflection we have to compute the second derivative. Since the first derivative is just a polynomial we can easily compute term by term with the power rule to get Possible points of inflection occur when , i.e. there is a possible point of inflection as . In order for it to be a point of inflection we require that the second derivative change sign as we cross . If the second derivative is positive, the graph is concave up; if it is negative, the graph is concave down.
Notice that the change in concavity, confirms that we do indeed have an inflection point at . 6. Sketch: The picture to the right |
{{#incat:MER CT flag||
}}


