Science:Math Exam Resources/Courses/MATH103/April 2011/Question 01 (b)
{{#incat:MER QGQ flag|{{#incat:MER QGH flag|{{#incat:MER QGS flag|}}}}}}
• Q1 (a) • Q1 (b) • Q1 (c) • Q2 (a) • Q2 (b) • Q2 (c) • Q2 (d) • Q3 (a) • Q3 (b) • Q4 (a) • Q4 (b) • Q5 (a) • Q5 (b) • Q5 (c) • Q5 (d) • Q6 (a) • Q6 (b) • Q7 (a) • Q7 (b) • Q7 (c) • Q8 •
Question 01 (b) | ||||||||||
|---|---|---|---|---|---|---|---|---|---|---|
|
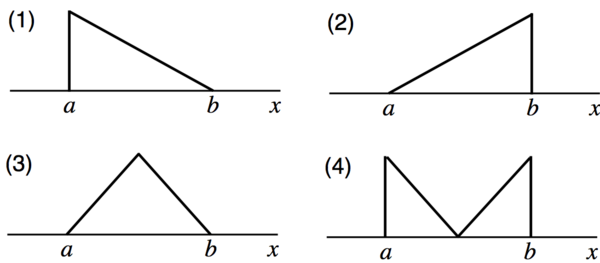
Consider the following four probability density functions (pdf):
|
|
Make sure you understand the problem fully: What is the question asking you to do? Are there specific conditions or constraints that you should take note of? How will you know if your answer is correct from your work only? Can you rephrase the question in your own words in a way that makes sense to you? |
|
If you are stuck, check the hints below. Read the first one and consider it for a while. Does it give you a new idea on how to approach the problem? If so, try it! If after a while you are still stuck, go for the next hint. |
Hint 1 |
|---|
|
The mean is the same as the average or expected value. Which of the given probability distributions has the smallest average value? You should be able to tell just by looking at the graphs. |
Hint 2 |
|---|
|
Variance is a measure of a measure of the "spread" of the distribution. A large variance means that we would typically expect to measure values that are far away from the mean. |
Hint 3 |
|---|
|
The standard deviation is the square root of the variance. Hence, it is also a measure of the "spread" of the distribution. A small standard deviation means that we'd typically expect to measure values close to the mean. |
Hint 4 |
|---|
|
4. The median is the value for which What does symmetry tell you about the mean and median in the last two distributions? To compare the first two, compute the median and mean in the simple case where and |
Hint 5 |
|---|
|
What is the total area under the graph of a probability distribution function? |
|
Checking a solution serves two purposes: helping you if, after having used all the hints, you still are stuck on the problem; or if you have solved the problem and would like to check your work.
|
Solution |
|---|
|
The first 3 can easily be deduced just by looking at the pictures. 1. The pdf with the smallest mean is (1). 2. The pdf with the largest variance is (4). 3. The pdf with the smallest standard deviation is (3). 4. The pdf with median larger than the mean is (2). By symmetry, both graphs (3) and (4) have the same mean and median. To decide between (1) and (2), we can compute the mean and median directly for (2). We can do this in the simple case where and . Then for some constant . Since , The mean is then The median is determined by , hence, which is larger than 5. The total area under the graph must be 1. Note that the area of a triangle is equal to half of its base length times its height; both triangles have the same area, with base length and height . Therefore, where is the maximal probability density. Hence, |
{{#incat:MER CT flag||
}}


