MATH101 April 2011
• Q1 (a) • Q1 (b) • Q1 (c) • Q1 (d) • Q1 (e) • Q1 (f) • Q1 (g) • Q1 (h) • Q1 (i) • Q1 (j) • Q2 (a) • Q2 (b) • Q3 (a) • Q3 (b) • Q4 (a) • Q4 (b) • Q4 (c) • Q4 (d) • Q5 (a) • Q5 (b) • Q5 (c) • Q6 (a) • Q6 (b) • Q7 • Q8 •
Question 02 (b)
|
Consider a solid whose base in the xy-plane is the finite region bounded by the curves and . The cross sections of the solid perpendicular to the x-axis with one side in the xy-plane are squares. Find the volume of this solid.
|
Make sure you understand the problem fully: What is the question asking you to do? Are there specific conditions or constraints that you should take note of? How will you know if your answer is correct from your work only? Can you rephrase the question in your own words in a way that makes sense to you?
|
If you are stuck, check the hint below. Consider it for a while. Does it give you a new idea on how to approach the problem? If so, try it!
|
Hint
|
Draw a picture. What are the limiting values on the x-axis?
|
Checking a solution serves two purposes: helping you if, after having used the hint, you still are stuck on the problem; or if you have solved the problem and would like to check your work.
- If you are stuck on a problem: Read the solution slowly and as soon as you feel you could finish the problem on your own, hide it and work on the problem. Come back later to the solution if you are stuck or if you want to check your work.
- If you want to check your work: Don't only focus on the answer, problems are mostly marked for the work you do, make sure you understand all the steps that were required to complete the problem and see if you made mistakes or forgot some aspects. Your goal is to check that your mental process was correct, not only the result.
|
Solution
|
Found a typo? Is this solution unclear? Let us know here. Please rate my easiness! It's quick and helps everyone guide their studies.
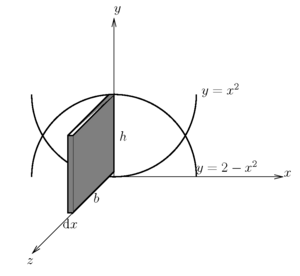
If we follow the hint, we can draw a diagram similar to the one pictured on the right . We have drawn the axis so that we see the plane in its familiar 2D position.
The first thing we have to consider is the limits of where our picture begins and ends. To do this, we find the intersection points of our two parabolas. Therefore we want to find the such that
which occurs when . Notice from our diagram that is the left endpoint and is the right endpoint. As we are told in the question, the cross section in the -direction is a square which we can think of as a rectangular prism with a very small depth, . Therefore, the volume of any one square, , is given by
Since the cross section is indeed a square we have that and this equals the height between the two parabolas. Therefore,
and thus for any we have that the volume of the rectangle is,
To get the total volume we have to add up all the little square volumes that we would sweep out from the start of our figure at to the end at . However, there are an infinite number of values in this range and so what would normally be a sum, we write as an integral. Therefore,
Therefore, the volume of the solid is .
|
Click here for similar questions
MER QGH flag, MER QGQ flag, MER QGS flag, MER RT flag, MER Tag Solid of revolution, Pages using DynamicPageList3 parser function, Pages using DynamicPageList3 parser tag
|
Math Learning Centre
- A space to study math together.
- Free math graduate and undergraduate TA support.
- Mon - Fri: 12 pm - 5 pm in LSK 301&302 and 5 pm - 7 pm online.
Private tutor
|