Science:Math Exam Resources/Courses/MATH100/December 2012/Question 06 (f)
{{#incat:MER QGQ flag|{{#incat:MER QGH flag|{{#incat:MER QGS flag|}}}}}}
• Q1 (a) • Q1 (b) • Q1 (c) • Q2 (a) • Q2 (b) • Q2 (c) • Q2 (d) • Q3 (a) • Q3 (b) • Q3 (c) • Q4 (a) • Q4 (b) • Q4 (c) • Q5 (a) • Q5 (b) • Q6 (a) • Q6 (b) • Q6 (c) • Q6 (d) • Q6 (e) • Q6 (f) • Q7 • Q8 • Q9 • Q10 • Q11 •
Question 06 (f) |
|---|
|
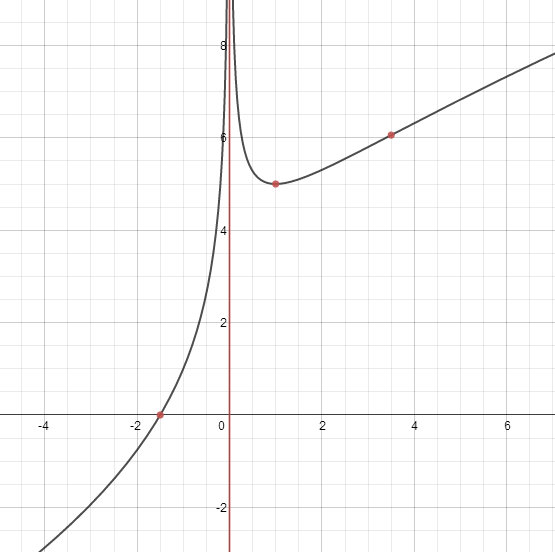
Full-Solution Problems. In questions 5-11, justify your answers and show all your work. If a box is provided, write your final answer there. Unless otherwise indicated, simplification of numerical answers is required in these questions. 6. Let . Note that the domain of ƒ is the set of all nonzero real numbers; for example, . (f) Sketch the graph of , exhibiting all features in parts (a) - (e) and showing the y-coordinates of any points you found in part (b) (you do not need to include the y-coordinates of inflection points). Also, indicate the coordinates of all x-intercepts. |
|
Make sure you understand the problem fully: What is the question asking you to do? Are there specific conditions or constraints that you should take note of? How will you know if your answer is correct from your work only? Can you rephrase the question in your own words in a way that makes sense to you? |
|
If you are stuck, check the hint below. Consider it for a while. Does it give you a new idea on how to approach the problem? If so, try it! |
Hint |
|---|
|
Start by finding the x-intercept(s). Then drawing the asymptote, intercepts and minimum should be a good start to drawing the entire graph. |
|
Checking a solution serves two purposes: helping you if, after having used the hint, you still are stuck on the problem; or if you have solved the problem and would like to check your work.
|
Solution |
|---|
|
Before assembling the graph, we will calculate the x-intercepts, found by setting the original function equal to zero and solving for x.
Factoring out gives:
So there is an x-intercept at To draw the graph, we will start by plotting the vertical asymptote at x = 0 and various points: the x-intercept at , the minimum at and the inflection point at . Because the question asks for the y-coordinate of the minimum (from part b), we plug x = 1 into f(x) to get:
So our minimum will be the point . All this gives a picture that looks like this: Using information from part a) about the intervals of increase and decrease, we know the graph should roughly look like this: Finally, using part c), we know the function is concave up for and concave down otherwise, which leads us to the final graph: |
{{#incat:MER CT flag||
}}


