Library:Circle/Usage Analysis - Item Report
Print me |
|---|
| Print this page |
Summary
This user guide shows you how to use the cIRcle Usage Analysis tool in the DSpace Reporting Suite module to generate a usage report at the Item level. This guide will provide details on how to create a report on the views for particular items. This user guide assumes a basic knowledge of the reporting suite's features as described in the guide, "Introduction to Usage Analysis for cIRcle," which can be found in the related links below.
For this example, we are going to look at the views of several items. These steps, however, can also be applied to generate a report on downloads or for a Bitstream-level report. The Bitstream level report is useful if you have multiple files, such as a paper and a presentation, attached to one record and you would like statistics for the individual files.
Please note, this advanced statistics reporting tool is only available to cIRcle staff and is used by to monitor and analyze view and download activity in the repository. Users may contact cIRcle staff to request a statistics report for more than 6 months on any item in cIRcle.
Related Articles
Introduction to Usage Analysis in cIRcle - for a general overview
Usage Analysis Report at the Community and Collection level
How to find and use statistics in cIRcle, UBC's digital repository - Video
Login
On the cIRcle homepage at https://circle.ubc.ca/, look at the left-hand menu for "My Account" and choose "Login".
![]()
Usage Analysis Report
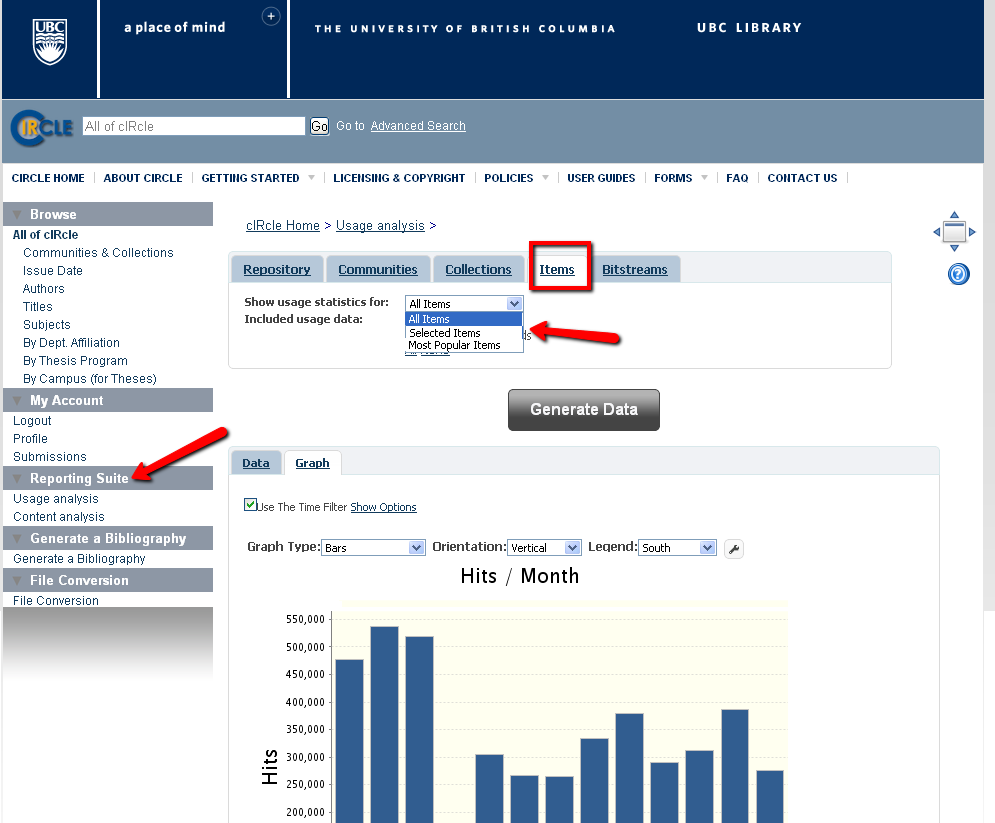
Once you have logged in, look for "Reporting Suite" in the left-hand navigation and select "Usage Analysis". In the Usage Analysis module, select the tab for Items then use the drop-down menu in the "Show usage statistics for:" and choose "Selected items".
|
Tip! Generating a report using the "Most Popular Items" feature is especially interesting. Top items can be viewed by their page views or downloads. The most useful report is Most Popular Items by the number of downloads. For this report, use the Item tab rather than the Bitstream tab. That way, you will see the title of the item whereas the Bitstream tab will only give you a list of the most popular downloads by file name and you will have to figure out with what item the file is associated. |
Select Items
To run a report on selected items, you have to know the exact "TITLE" of the item(s)--text searches are not effective within the module. To begin, it is best to open a separate window or tab in your browser and locate the item(s) first in cIRcle.
For this example, we will use a thesis entitled Balancing the other 'scale' of justice : nurturing work-life balance in the legal profession. Copy this title to add it to your clipboard.

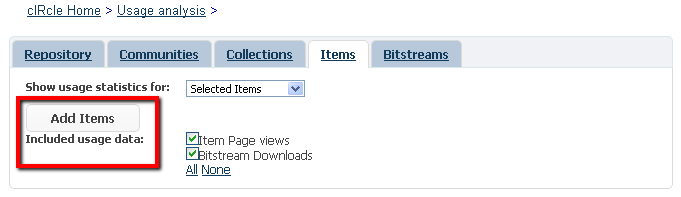
Go back to the Usage Analysis tool and click on the "Add Item" button.
Copy and past this title into the search box and use quotation marks "" to ensure you get an exact match. Click "Enter" to execute the search. The program should automatically find the title for you, but you will still need to choose it by selecting the green plus sign. You can continue adding multiple items by copying and pasting their titles one at a time and selecting the green plus sign to confirm your selection. You can also use the Scope filter to drill down to a specific collection eg. Electronic Theses and Dissertations (ETDs) 2008+ to ensure greater accuracy. Default scope is set to "All of cIRcle".

|
IMPORTANT! You can also see if your selection was added to the report before closing down the "Add Item" box by simply clicking on the box with your mouse and dragging it off to the side. |
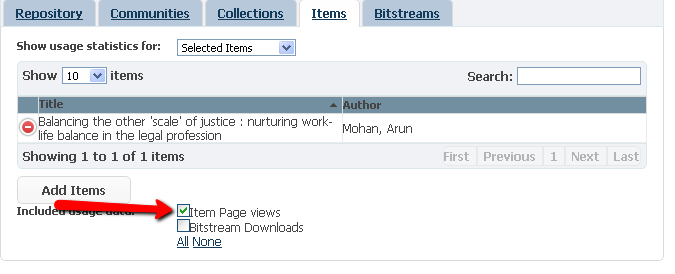
When you have finished adding items, click the "X" in the top right hand corner of the "Add Item" box to close the form and review your selections.
Included Usage Data
Now that you have your selected items, look at the "Included usage data" section of the page. For this report we only want the Item Page Views so deselect "Bitstream Downloads".
| IMPORTANT!
The default report criteria has all options selected. Running this type of report will provide you with a Summed total which may not be useful data. To see both the view and download statistics for an item, you will need to generate separate reports. See the Introduction to Usage Analysis in cIRcle for more details.
|
Select the Time
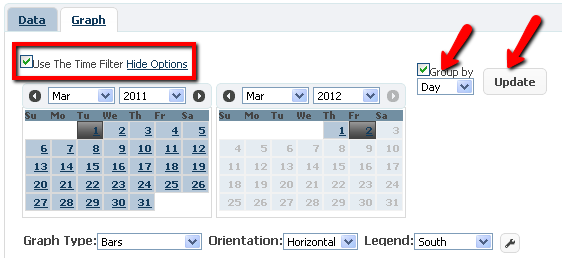
For this report we want to see views for this items all activity for this item, so we will need to change the time frame. Scroll down below the "Generate Data" button, and go to the Data/Graph portion of the page then select "Use The Time Filter Show Options".
For this item, change the start date to "Dec" "2009" and click "Update". You can experiment with the date ranges for your item reports though you may want to look at the view or download statistics for an item from the date it was added to cIRcle. This information can be found in the item record under "Copyright date" for theses and dissertations and "Issue date" for all other materials.
Confirm that your report is for "Item Page Views" and your Time Filter is set for "Dec 2009" to today's default date. Now select "Generate Data"
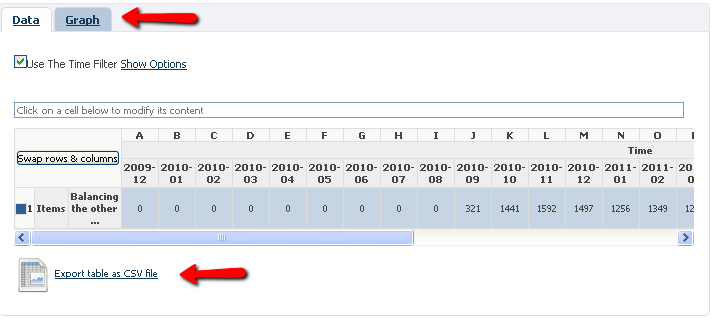
Results
Your results will appear in a graph view which you can easily change around as you desire. From bar, pie, or line charts, to the orientation, and legend you can quickly visualize your results.
If you select the Data tab view, then you will see the figures which created the chart. These figures can be very helpful for further data analysis. If you would like to see the figures in a spreadsheet, choose the "Export table as CSV file" at the bottom.
To learn more about how to manipulate data in Excel and creating charts, please see our video How to find and use statistics in cIRcle, UBC's digital repository.
Conclusion
Congratulations! You have now created a usage report!
To exit cIRcle, go to the left-side menu and locate “My Account”, then click on “Logout”.
Any questions or feedback? Please contact us