Library:Circle/Usage Analysis - Collection Report
Print me |
|---|
| Print this page |
Summary
This user guide shows you how to use the cIRcle Usage Analysis tool in the DSpace Reporting Suite module to create a Collections level report. This report will provide details on how to create a report on the views and downloads within a collection. This user guide assumes a basic knowledge of the reporting report's features as described in the "Usage Analysis Guide," which can be found in the related links below.
For this example, we are going to look at the views of several Sub-Collections. These steps, however, can also be applied to a Communities level report.
Please note, this advanced statistics reporting tool is only available to cIRcle staff. Please contact cIRcle staff for statistics reports requests.
Related Articles
Usage Analysis Guide - for a general overview
Usage Analysis Report - at the Item or Bitstream level
How to find and use statistics in cIRcle, UBC's digital repository - Video
Login
On the cIRcle homepage at https://circle.ubc.ca/, look at the left-hand menu for "My Account" and choose "Login".
![]()
Usage Analysis Report
Once you have logged in, look for "Reporting Suite" and select "Usage Analysis"

Select the tab for Collections and in the "Show usage statistics for:" drop-down box, choose "Selected collections"

Your page will now provide you with a drop-down tree structure of the Collections. For our example, we are going to look at the usage statistics for the "BC Reclamation Symposium." Use the tree structure to find the symposium by selecting:
Faculties and Schools > Applied Science, Faculty of > Mining Engineering > British Columbia Mine Reclamation Symposium
Once you have located the sub-collections, select all of the check-boxes.

Select the Time
For this report we want to see all activity in this sub-community, so we will need to change the time frame. Below the "Generate Data" button, go to the Data/Graph portion of the page and select "Use The Time Filter Show Options".
Change the start date to "Dec" "2009".
Included Usage Data
Now that you have selected the sub-collections and your time frame, look at the "Included usage data" section of the page. You will see that all three check-boxes are selected. As described in the Usage Analysis Guide, by using the defaulted values your report will provide you with a summed total of the community page views, item views, and Bitstream downloads. For this report we only want the Item Page Views.

To create a report for the Item Page Views, deselect "Collection Homepage views" and "Bitstream Downloads".
Confirm that your report is for "Item Page Views" and your Time Filter is set for "Dec 2009" to today's default date. Now select "Generate Data"
| IMPORTANT!
The default report criteria has all options selected. The report will provide you with a Summed total which will give you unreliable data. To create a report for the individual levels, separate reports will need to be run. |
Results
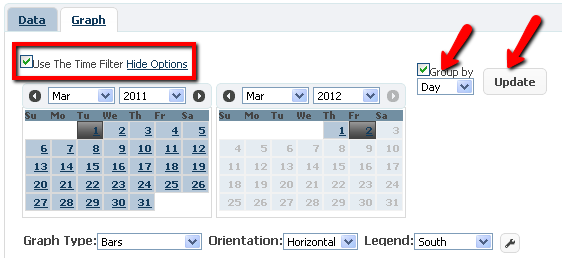
Your results will appear in a graph view which you can easily change around as you desire. From bar, pie, or line charts, to the orientation, and legend you can quickly visualize your results.
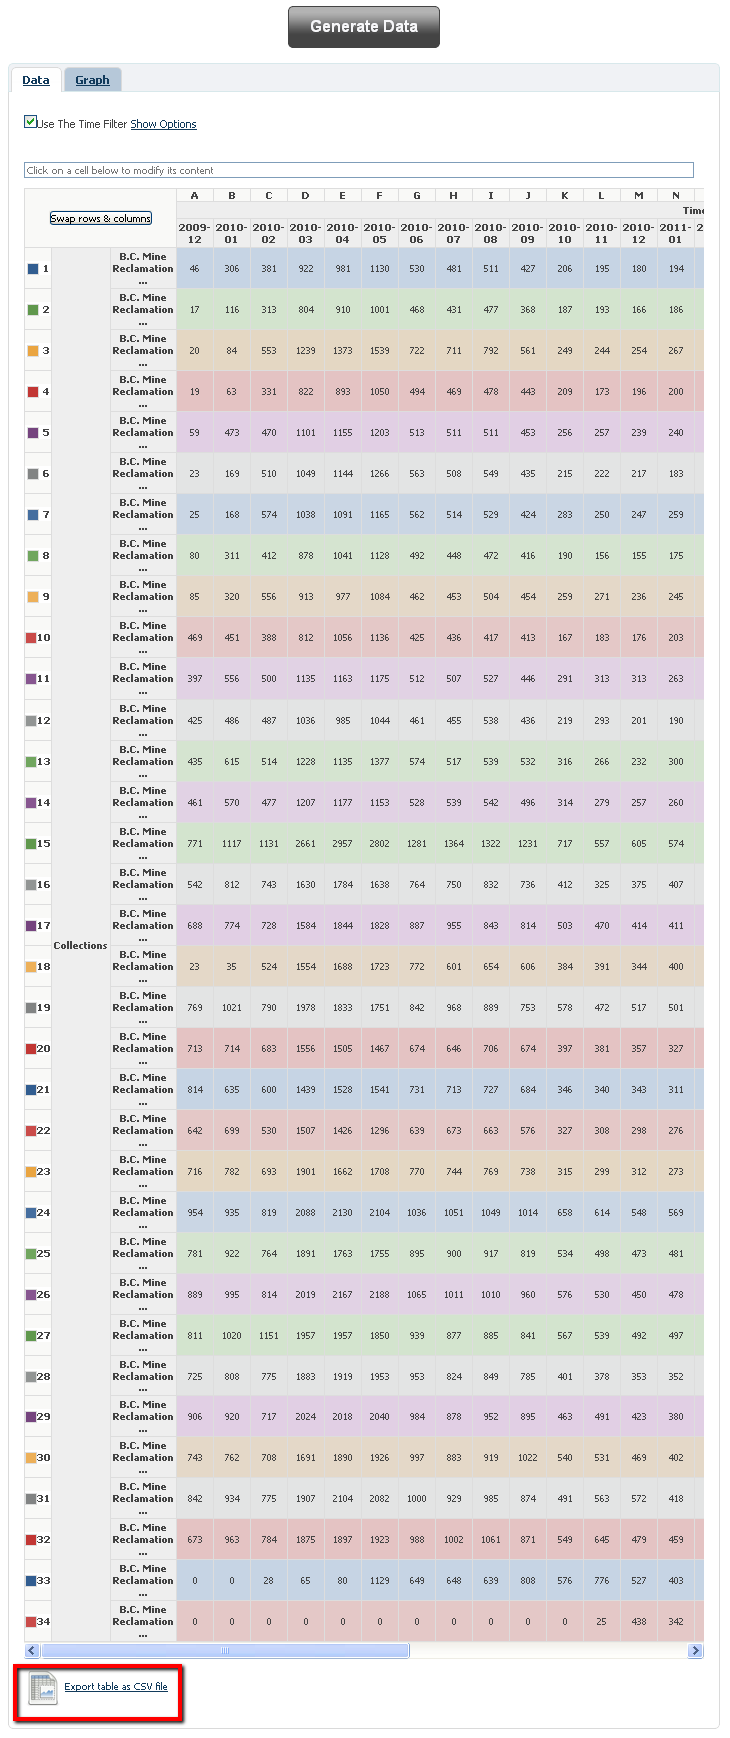
If you select the Data tab view, then you will see the figures which created the chart. These figures can be very helpful for further data analysis. If you would like to see the figures in a spreadsheet, choose the "Export table as CSV file" at the bottom.
To learn more about how to manipulate data in Excel and creating charts, please see our video How to find and use statistics in cIRcle, UBC's digital repository.
Conclusion
Congratulations! You have now created a collection report!
To exit cIRcle, go to the left-side menu and locate “My Account”, then click on “Logout”.