Library:Circle/Usage Analysis
Print me |
|---|
| Print this page |
Summary
This guide is an introduction to the different functions and features of the cIRcle Usage Analysis tool in the DSpace Reporting Suite module. This advanced statistics reporting tool is only available to cIRcle staff and is used to monitor and analyze view and download activity at each level of the DSpace hierarchy. Any author of cIRcle content who wishes to have a statistics report for their items can contact cIRcle staff.
Related Articles
Usage Analysis Report at the Community and Collection level
Usage Analysis Report at the Item or Bitstream level
How to find and use statistics in cIRcle, UBC's digital repository - Video
Overview
The Usage Analysis tool in the DSpace Reporting Suite module in cIRcle offers greater functionality for displaying view and download statistics than the Statistical Information charts provided on collection and item pages. This module allows you to create usage reports for all levels of the DSpace hierarchy with filters for date range, most popular items, and more. The full range of options include:

- Repository homepage visits
- Community homepage visits
- Collection homepage visits
- Item display visits
- Bitstream downloads
| IMPORTANT!
For instructions on how to run a specific type of Usage Analysis report, see the related articles listed above. There is also a video tutorial showing how to create a report of multiple sub-collections, how to export report data to excel, how to separate the data, and how to create a chart of multiple data sets. |
Within each of the menu options for the reporting suite, you can run reports across multiple levels of the DSpace hierarchy depending on the usage activities you wish to monitor and analyze. The default report is set to include all levels within the DSpace hierarchy. By selecting or deselecting options within the menu you can run an exhaustive range of reports. For example, under the Repository tab, you can run a report on all the Community, Collection, Item and Bitstream usage across the entire repository. For a more focused approach, you would select only the options most relevant to the type of report you wanted to generate. For example, under the Collections tab, you might only select a few of the specific collections you were interested in monitoring and review which were the most popular items within these collections in the last year. Using the Item level tab, you could pull statistics for all works in cIRcle by a particular author. However, it is important to note that while you can drill down for information, you cannot run a report and then try to associate the results to a higher level within the repository. For example, if you run a report at the Item level to see what are the top 10 items for this month, you would not see with what Community or Collections these items are associated.
DSpace Hierarchy
To give you a working knowledge of how these components relate to one another, let's look at how the cIRcle repository is structured. The repository is organized according to the hierarchy imposed by DSpace, the repository software used by cIRcle. At the Community and Collection level, there can be several sub-sites. For example, the Faculties and Schools Community has sub-communities such as Applied Science, Faculty of and Arts, Faculty of and within each of these broad faculties, there are further sub-communities such as Chemical and Biological Engineering or History. Within these Communities, there are then Collections such as Chemical and Biological Engineering > Chemical and Biological Engineering Theses and Dissertations & 6th International Conference on Gas Hydrates.

By way of example, let us look at one of cIRcle's most popular items Balancing the other 'scale' of justice : nurturing work-life balance in the legal profession. Here, you can see how within cIRcle there is the Community "Faculties and Schools" and its Collection "Law School" with the sub-Collection "Law Student Theses and Dissertations". Within this sub-Community there is the item "Balancing the other 'scale' of justice : nurturing work-life balance in the legal profession" and the actual PDF file or Bitstream "ubc_2010_fall_mohan_arun.pdf".
In a sense, the DSpace hierarchy resembles a nesting doll with Repository as the largest doll and bitstream as the smallest. To run a useful usage analysis report, therefore, it is important to know which level you are interested in analyzing. Do you want to see usage activity for a single collection of faculty papers, for example, or do you want to see how many times a particular paper was downloaded since it was archived in cIRcle? In general, collection administrators are interested in monitoring usage activity on myriad levels. This guide is intended, therefore, to provide an overview of the features and functions of the Usage Analysis tool to help familiarize you with the types of reports you can generate. For instructions on how to generate specific reports, please refer to the guides listed above in Related Articles.
Usage Analysis
The Usage Analysis screen has two sections. The top portion of the screen allows you to choose the type of report you would like to generate. The bottom half of the screen provides you with the results. Both sections have tabs which you may use to toggle between menu options.
Reports can be created within the five levels within cIRcle: Repository, Community, Collection, Item, and Bitstream. You can select which level of the repository to use by selecting the appropriate tab. To run a report you can control the following parameters: the scope of your statistics, the type of usage data, and the time period.

Scope
Reports can be created with statistics for:
- All Communities/Collections/Items/Bitstreams
- Selected Communities/Collections/Items/Bitstreams
- Most Popular Communities/Collections/Items/Bitstreams
Please note, at the Repository level, you are not able to select these choices.
All
“All …” shows all of the items at that level, within your search criteria; however, this option is not recommended as the results appear to stop after 100. This means that a report looking at “All…” the data at a Collections, Items, or Bitstream level will be extremely limited. If you would like to create a report for "All" items beyond the 100 item limit, please see the "Most Popular" option.
Selected
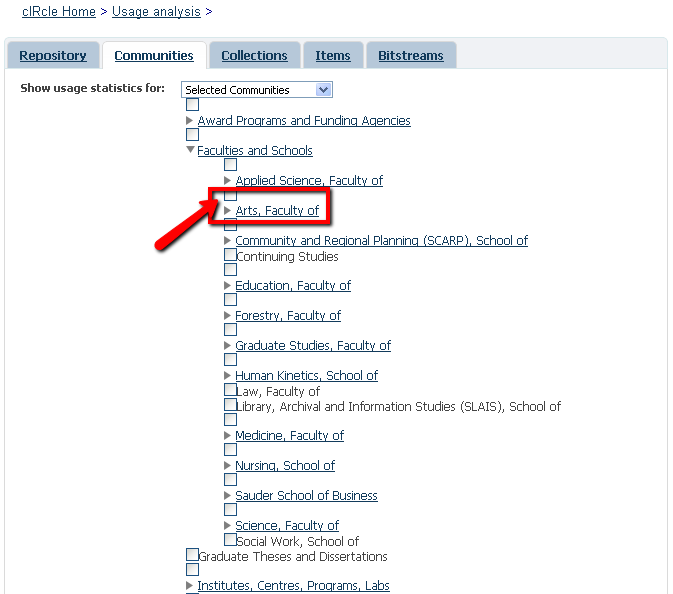
The “Selected …” drop-down menu allows you to narrow the scope of your report. The style and usage of this menu option varies between the four sections. In Communities and Collections, you will be able to choose from an expandable list to select the community or collection of interest, but in the Item and Bitstream sections you will need to enter details to locate the items or files you want to view.
When using the "Selected..." drop-down menu at the Communities level, you can select a Community by clicking on the appropriate check box or use the triangle to expand the selection to include sub-communities (eg. Arts, Faculty of--History). The Collections tab works in a similar list structure.
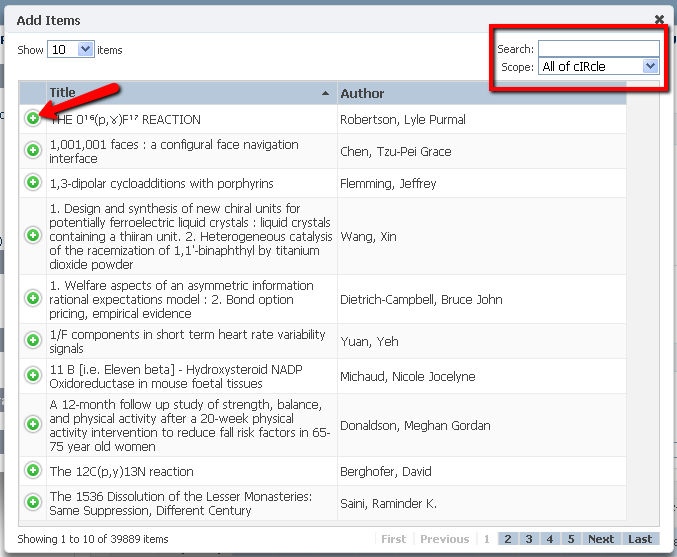
When using the drop-down “Selected …” menus for the Items and Bitstreams tabs, an "Add..." box will appear. Clicking the “Add …” box will activate a pop-up menu which will allow you to search for an item or bitstream; however, you must know all or a portion of the title to locate the bitstream for an item in order to use this feature. An author or URI search will not locate the item or bitstream.
For example, to locate a thesis, in this case “Balancing the other 'scale' of justice : nurturing work-life balance in the legal profession”, enter the title and use quotation marks "[TITLE]" to ensure you retrieve an exact match. In this case, copy the title and paste it into the Search box then add quotation marks and hit "Enter". When the item is found, select the green plus symbol, to add it to your report. You may then add more items to create a multi-item report. You can also use the Scope filter to drill down to the collection you are looking for. Default Scope is set to "All of cIRcle".
For more detailed instructions, see Usage Analysis Report at the Item or Bitstream level
Most Popular
“Most Popular …” allows you to find the top viewed/downloaded items. The default is for the top 10 records, but the user can designated the number of records by typing them in. The precise limit of records which can be generated for this report are not known, but a 500 “Most popular Item” report is easily generate while a 1000 item report failed.
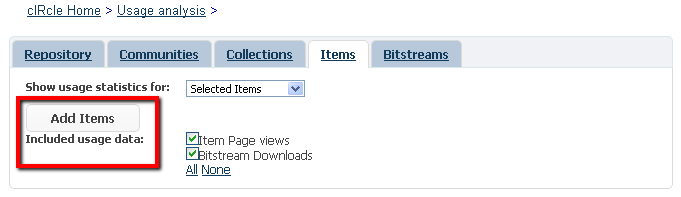
Included Usage Data
The "Included usage data" option allows you to select the type of data in your report. You will want to scrutinize these options very closely as you may find unexpected results. In any case, it is important to know what the different terms mean in the Reporting Suite.
A Glossary of Terms
In general, a page view or simply a view is counted every time a web browser loads a page. Since the relevant code that counts these views is part of the script of the page itself, every time the html code that describes the page is run by a browser, one new page view is tallied. For example, this means a new page view would also be counted if you refresh or reload a page you have already visited. In some instances, the phrase page display is used interchangeably with page view.
The Reporting Suite module keeps track of such views at the Repository, Community, Collection, and Item levels. In some of the tabs available on the Usage Analysis screen, choosing an option from among the "Included usage data" choices gives the total sum of all page views from the current level as well as those contained within it in the DSpace hierarchy. For example, if you run a report in the Communities tab for the Most Popular top 10 Communities, choosing "Community Homepage views" will give you a count of how many times the particular Community's homepage was viewed, plus the number of views of all lower sub-communities' homepages contained within this Community. However, this cascading total does not count page views of any collections or items within these communities. To count these, you would have to check the "Collection Homepage views" or the "Item Page views" boxes.
| Repository tab | Communities tab | Collections tab | Items tab | Bitstreams tab | |
|---|---|---|---|---|---|
| Repository Homepage views | total views of cIRcle homepage, namely circle.ubc.ca/ | -- | -- | -- | -- |
| Community Homepage views | sum of homepage views of all communities (but not sub-communities) in cIRcle | total views of selected communities' homepages plus views of all contained sub-communities' homepages | -- | -- | -- |
| Collection Homepage views | sum of homepage views of all collections in cIRcle | total homepage views of all collections contained in selected communities, including those contained in any sub-communities | total views of selected collection homepages | -- | -- |
| Item Page views | sum of page views of all items in cIRcle | total page views of all items contained in selected communities or in any sub-communities | total page views of all items contained in selected collections | total page views of selected items | -- |
| Bitstream Downloads | total number of file downloads from all of cIRcle | total number of file downloads from selected communities and any sub-communities | total number of file downloads from selected collections | total number of file downloads from selected items | total number of downloads of selected files |
Note that the Bitstream Downloads usage data option counts the number of times any particular file is downloaded. You might sometimes see the phrase "File Download" used instead.
Depending on which tab is selected on the Usage Analysis screen, the "Included usage data" options include only those levels from the list above that are at or below the selected tab level. That is, if we are on the "Collections" tab, then we only see the Collection Homepage views, the Item Page views, and the Bitstream Downloads options that can be included in our report. If we are on the "Items" tab, then we only see the two options for Item Page views and Bitstream Downloads. Thus the "Bitstreams" tab has no options available, and does not even show the "Included usage data" heading. In this case, selecting Bitstream Downloads will show the Communities ordered by highest number of files downloaded.
What happens if you select more than one measure to count in the “Included usage data” option? Then the individual options are added together and only the totals are shown in the report.

| IMPORTANT!
The default report criteria has all options selected. The report will provide you with a summed total which will give you aggregated and therefore unclear results. To create a report for the individual levels of the DSpace hierarchy, separate reports will need to be run. |
Time Period
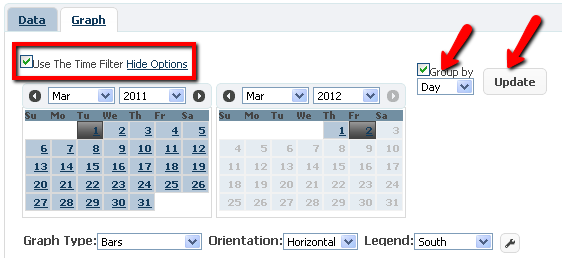
Reports are generated to show results from the past year, but the user can refine these results. Select the “Show options” link just below the Data and Graph tabs, allows you to choose your date range and to group the information by day, month, or year.
Once you have selected the date parameters you can get the results by clicking on either "Update" or "Generate Report". Use "Update" if you have already run a report and only need to refine the time. Use "Generate Report" if you have not yet run the full report.
Results
Once you have selected your report's parameters, you can select "Generate Data". Your results will display in the bottom half of the report in the Graph and Data tab.
Graph
By default, results will be shown as a Bar chart, but you can alter your chart's type, orientation, legend, and preferences.

Graph Type
For representing your data, you can select from several graph types including: bars, 3-D bars, stacked bars, 3-D stacked bars, pie, 3-D pie, line, points, line & points, area, and stacked area.
Orientation
Orientation allows you to tilt your chart on its axis from the Vertical default to a Horizontal position. Changing the orientation can improve the display of the date range on the chart as it is easier to show a full date in a stacked position.
Legend
The legend is shown at the bottom (or "south") of the chart. You can choose to move it to the north, east, or west of the chart. You can also choose to suppress it with "Not Shown".
Preferences
If you select the small wrench icon, you will be able to modify the chart's preferences. You can alter the graph title, height, width, background color, grid color. If you would like to change the colours, the chart uses the HTML colorHEX standard.
Data
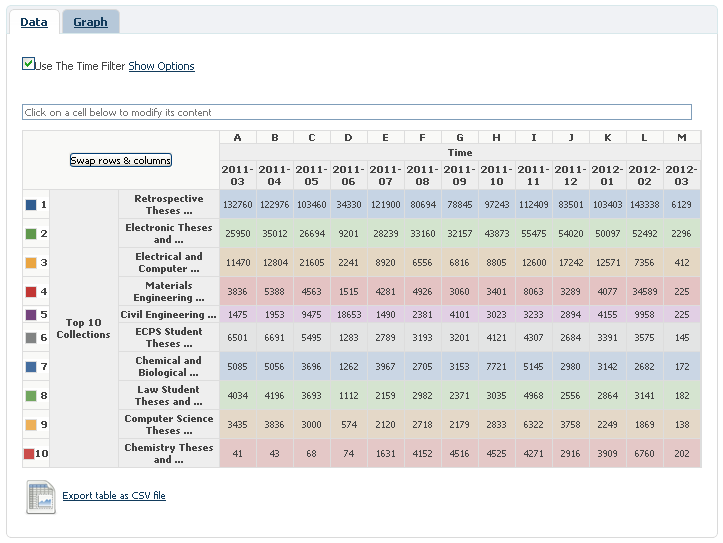
The data tab allows you to see the numeric values of your report.
There are two additional features in this view. "Swap rows & columns" allows you to transpose the x&y axis. After making this alteration, you can also see the results in the Graph feature. The other useful feature is "Export table as CSV file" which allows you to use the data in excel.
To learn more about using excel with the Usage Analysis report see our video How to find and use statistics in cIRcle, UBC's digital repository.
Logout
To exit cIRcle, go to the left-side menu and locate “My Account”, then click on “Logout”.
Any questions or feedback? Please contact us