Course:MATH103/Archive/2010-2011/207/Lectures/Lecture17
| Faculty of Science Department of Mathematics | |
|---|---|

| |
| Course Pages | |
| Course Policies | |
| Math Solvers | |
| Exams | |
| Quizzes | |
| Assignments | |
| Lectures | |
Lecture 17
Readings For This Lecture
- Chapter 8, Pages 153 to 157 (up to subsection 8.3)
Summary
Group 11: Add a summary of the lecture in this space. Include examples, discussion, and links to external sources, if desired.
Exercises
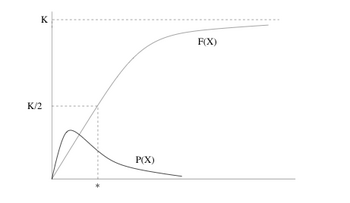
1. The figure below shows the graphs of a probability density function, and of a cumulative distribution function, corresponding to it. What is the value of the constant ? What is the special feature of the point marked *? Is the mean the same as the median in this case?
Solutions:
K = 1
The point marked * is the median.
The mean is not the same as the median. The graph of P(X) is not symmetrical.
2. The probability density distribution of grades on a mid-term test (out of a total score of 10) was found to be
. Was the test easy or hard? Explain your answer.
The test was hard. The probability density is the highest towards the left side of the graph, where the lowest marks are found.
3. For the probability density function , find the constant and the cumulative distribution function, .
p(x)= -Cx^{2}+Cb^{2} so the integral of p(x) = 1 = -(Cx^{3}/3)+Cb^{2}x evaluated from -b to b and solving for C gives <math> C = -3/{2b^{3}} <math>


