Course:EOSC270/2022/EOSC270/2022/Group 10-Causes and Effects of Coastal Eutrophication
What is the problem?(Yiyun Mao)
What is Eutrophication?
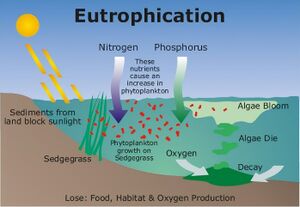
Eutrophication is a process by which a body of water become enriched by nutrient[1]. The input of nitrogen and phosphorus are the primary causes of eutrophication[2]. It starts with the increased load of nutrients to coastal waters [3]. Since the environment become enriched with nutrients, the amount of plant and algae growth increased to coastal waters, and leading to fish kills, dead zones, and harmful algal blooms as the consequence of eutrophication[3]. Coastal waters growing darker is one of the most obvious phenomena for eutrophication. Darker coastal water will cause the raw biomass of phytoplankton to decrease, and methyl mercury stays longer in coastal water[4].
What Human Actions Cause the Problem?
Overfertilization: Over nitrogen source to the coastal water may cause eutrophication and the largest nitrogen source is transferred to coastal ecosystem by synthetic fertilizers[2].
Wastewater: Human discharging wastewater to sea. 80% of urban untreated wastewater is released into environment[2].
Mariculture: The excrement of mariculture fishes contains a great value of nitrogen and phosphorus[2].
Where does the Problem Occur?
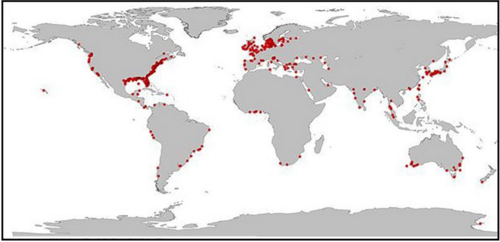
Eutrophic Coast Example[2]:
- East China Sea
- Baltic Sea
- Great Barrier Reef
- Main Stem of Chesapeake Bay
- Northern Adriatic Sea
- Coastal Upwelling: Santa Barbara Channel
How Pervasive is the Problem?
Eutrophication is a regional problem, rather than global problem. Usually occurs in several region:
- East and West Coasts of North America
- West coast of Europe
- Coast of China
- Coast of Japan
- South Coast of Australia
How does this problem impact marine ecosystems?(Hongpeng Mao)
How and why does it impact the identified ecosystems?
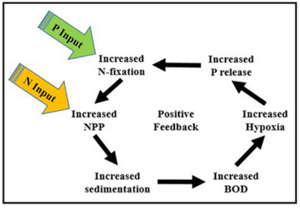
Eutrophication will create abundant blooms of noxious, foul-smelling phytoplankton. Most of the harmful algal blooms are formed by dinoflagellates or cyanobacteria[2]. The mass propagation of phytoplankton blooms produces more degradable organics, and fuels the oxygen demand and regeneration of P in the marine ecosystem (Shown in Figure 2). In addition, abundant phytoplankton blooms will reduce the water clarity and quality. As a result, the light penetration is limited to a low level, and the rate of photosynthesis for the underwater seagrasses will then be reduced. The increase of the photosynthesis rate will deplete the dissolved carbon element and raise the pH value[6]. Furthermore, when the algal blooms die, the process of decomposition consumes massive dissolved oxygen, and create an anoxic “dead zone” for little oxygen supply for organisms.
Are there unique characteristics of this habitat that make it vulnerable?
Clear water and low macroalgal cover promote high coral species richness[7]. The increased amounts of phytoplankton will lead to the increase of Chlorophyll on the ocean surface. The photosynthesis one the water surface will deplete the inorganic carbon and raise the pH value,[6] while the carbon is the main resource for coral to calcification. The increase of pH value and the decrease of penetration are also restraining the coral calcification. That will lead to the loss of the habitat. The warm water coral reefs have been declined by at least 50% [8], due to the increasing Chlorophyll concentration and macroalgal cover.
What organisms dose it impacts?
- Cod has experienced a marked decline in mean body condition (weight at a specific length)[9].
- Decline of seagrass and intertidal brown algae.
- Human health is potential to be harm.
How and why does it impact this organism/s?
- Due to the limited light penetration and “dead zones”, the hypoxic situation will lead to the habitat loss and lack of benthic macrofauna, disrupting the benthic food webs. l This will lead to the death of fish groups. The limited light also restrict the growth of the underwater seagrasses and plants. The amount of them is decreased.
- The amount of Nodularia spumigena which is a N-fixing cyanobacteria will be increased by eutrophication. This cyanobacteria can produce hepatotoxins that can cause liver damage for human[2].
What is the extent of the problem? (Tim Chen)
What are the measurable ecosystem changes that have occurred?
Globally, the ocean surface level of concentration of chlorophyll-a has increased 4.1% between 1998 and 2003. Most increases are found in coastal regions[10]. This is thought to be a consequence of anthropogenic nutrients input into coastal ecosystems[2].
Some major measurable coastal-eutrophication-induced changes in coastal ecosystems include:
1. Changes to phytoplankton community: Species shift to larger diatoms and dinoflagellates which leads to consequent changes in higher trophic levels[11].
2. Harmful algal bloom (HAB): Fast-developing algal species affect the ecosystem by physically blocking fish gills, depleting oxygens as they decay, secreting toxins and destructing habitats[11].
3. Changes to benthic communities: When those algae die, the microbial decomposition consume dissolved-oxygen and create a hypoxia/anoxia zone in which oxygen concentration is too low to support the original populations[12]. This effect can lead to massive loss of benthic macrofauna diversity and biomass[11].
4. Changes to trophic linkage: Eutrophication change the feeding habit of higher-level benthic consumers. Zoobenthos energy source shifts to epipelagic primary production (phytoplankton). Eutrophication-caused species shift can also contribute to change in trophic linkage[11].
5. Changes to seagrasses: Rapid increase in phytoplankton and macroalgae abundance severely block light penetration, which hinder the photosynthetic activities of benthic rooted sea grass, causing seagrass biomass, distribution and density decline[11].
6. Changes to coral reefs: Eutrophication interfere the recruitment of corals, leads to decrease in corals mortality, abundance, diversity and thus coral-related communities[11].
7. Changes to fish: Fish die-offs were often reported in HABs regions, resulting in changes to fish community structures[11].
What is the present status compared to the past?
(A). Open continental shelf ecosystems:
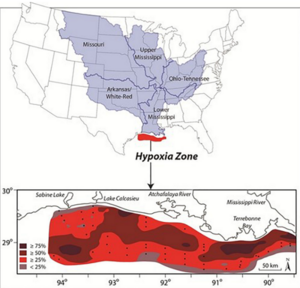
(1) Northern Gulf of Mexico: the seasonal hypoxia zone has been expanding since 1950s. In 2000, area of hypoxia is less than 5000km2, and it increased to 22720km2 in 2017. It has become one of the largest open shelf "dead" zones (Figure 2)[13][2].
The primary toxic species in Northern Gulf of Mexico, dinoflagellate Karenia brevis was usually <1 cell/ml, and it has increased to >10 cells/ml during annual bloom recently[2].
(2) East China Sea
There was an increase of input (from ChangJiang) of Nitrogen from 0.220*109 kg/year in 1970, and 2*109 kg/year in 2012[2].
Hypoxia zone in this region was first reported in 1959, the area was about 1800km2. This number has increased to about 13700km2 in 1999 and >15400km2 in 2006[2]. Now, the Hypoxic bottom water covers > 15% of East China Sea, making it one of the biggest coastal hypoxia zones in the world.
Reported HAB event has increased from 0 times in 1950s, 10 times in 1970s, 25 times in 1980s to more than 100 times in 1990s. this trend continued between 2000 to 2006[2].
(B). Semi-enclosed ecosystems:
(1) Baltic Sea
River accounts for about 70% of the nutrients input. The anthropogenic nutrients input was high from 1995 to 2002, specifically 0.65-0.90*109kgN/year and 33-43*106kgP/year. This number decreased to 0.50-0.78*109kgN/year and 22-35*106kgP/year, measured from 2003 to 2015 (2003-2015 was a dry period, meaning low river input)[2].
Mean chlorophyll concentration stabilized at <1 ug/liter from 1880 to 1950, this number increased to 2-4 ug/liter from 1990 to 2009[2].
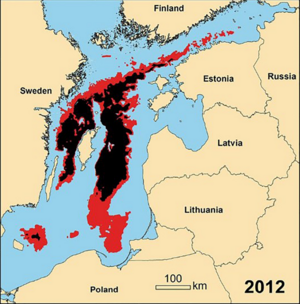
The hypoxic bottom water increased during the last 30 years. area increased from about 5000 km2 to about 70000 km2 from 1993 to 2016[2].
What is the prognosis for the future if we continue our current trajectory?
Summarized from the last two section, if the level of anthropogenic nutrients input into the coastal regions remains, the eutrophication effects will be intensified and the eutrophic area would expand. However, the future also depends on the anthropogenic control and treatment of eutrophication in which the effectiveness varies.
Given the impact, what are the solutions? (FanXuan Sun)
The Local solution:
Many countries try to solve the problem of eutrophication by reducing the amount of chemical fertilizer to reduce the emission of nitrogen and phosphorus. Because most areas have the problem of over fertilization of agricultural soil. Some Nordic countries, such as Denmark, have taken action to prevent water pollution from agricultural land. Compared with the mid-1980s, these schemes succeeded in reducing total nitrogen losses from farmland by about 50%[14].
Eutrophication is particularly severe in the Baltic region. Scientists in Sweden have long proposed farmed mussels to combat eutrophication. Farming native mussels along the Baltic coast can control the nutrient content of Baltic water with less harm and greater benefit. Mussel farming can not only provide good economic benefits for local people, but also objective ecological benefits. In Gren et al. 's study, this method also showed a very low marginal cost, which was superior to other methods[15].
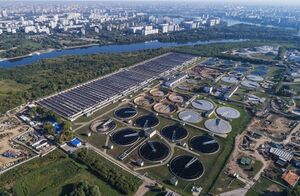
A study in Finland showed that investment in improved wastewater treatment facilities could improve coastal areas affected by phosphorus sediment release[16]. This can greatly reduce the economic losses caused by eutrophication. Furthermore, over time, the cost of reducing nutrients in seawater is also very low. Therefore, this measure of upgrading sewage treatment capacity is a good means to combat eutrophication.
Global solution:
Studying eutrophication from the perspective of the whole ecosystem is the current development trend [17]. So one should monitor the cascade effects and feedbacks of ecosystem components in greater detail. It is important to have ecosystem monitoring models and frameworks to help diagnose problems and implement specific plans. In addition, people need to communicate with regulators and legislators to make them more aware of the complexity of the problem and the need for monitoring and regulation. When lawmakers make regulations, they need a lot of standards backed by a lot of data, so scientists and lawmakers need to communicate together to assess the ecological, political and economic conditions of the entire coastal area. Policy makers will best support efforts to address eutrophication by developing environmental policies and action frameworks[18].
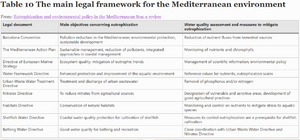
The governance and supervision system and measures of the Mediterranean Sea area are an example of the global coastal waters[19]. There is a legal framework with complete scientific knowledge in the Mediterranean region. In addition, local governments have invested in governance. The following figure shows the main laws and regulations in the Mediterranean region.
The whole legal framework of Mediterranean Sea area lists the reduction of pollutant input and sustainable management as the key measures to protect coastal areas. The eutrophication monitoring required by the Med pol framework is divided into multiple stages and serves as the benchmark for coastal eutrophication monitoring. The whole system judges the health degree of the ecosystem by monitoring the ecological index describing and integrating the community structure and function.
References
- ↑ "Human Causes of Eutrophication". Study[video]. 2013.
- ↑ 2.00 2.01 2.02 2.03 2.04 2.05 2.06 2.07 2.08 2.09 2.10 2.11 2.12 2.13 2.14 2.15 2.16 Malone, T. C., & Newton, A. (2020). "The globalization of cultural eutrophication in the coastal ocean: Causes and consequences". Frontiers in Marine Science. 7.CS1 maint: multiple names: authors list (link)
- ↑ 3.0 3.1 National Oceanic and Atmospheric Administration. "What Is Eutrophication?". National Ocean Service.
- ↑ Johnson, D (2021). "The Environmental Threat You've Never Heard Of". Hakai magazine,Coastal Science and Societies.
- ↑ Breitburg, D., Levin, L. A., Oschlies, A., Grégoire, M., chavez, F. P., conley, D. J., Garcon, V., Gilbert, D., Gutierrez, D., Isensee, K., jacinto, G. S., limburg, K. E., Montes, I., Naqvi, S. w. A., Rabalais, N. N., roman, M. R., Rose, K. A., Pitcher, G. C., Seibel, B. A., … Zhang, J. (2018). " Declining Oxygen in the Global Ocean and Coastal Waters". Science. 359(6371). no-break space character in
|title=at position 1 (help)CS1 maint: multiple names: authors list (link) - ↑ 6.0 6.1 Bell, P. R., Elmetri, I., & Lapointe, B. E. (2013). "Evidence of large-scale chronic eutrophication in the Great Barrier Reef: Quantification of chlorophyll a thresholds for sustaining Coral Reef Communities". AMBIO. 43(3): 361–376.CS1 maint: multiple names: authors list (link)
- ↑ De'ath, G., & Fabricius, K. (2010). "Water quality as a regional driver of coral biodiversity and macroalgae on the Great Barrier Reef". Ecological Applications. 20(3): 840–850.CS1 maint: multiple names: authors list (link)
- ↑ Bell, P. R. F. (1992). "Eutrophication and coral reefs—some examples in the Great Barrier Reef Lagoon". Water Research. 26(5): 553–568.
- ↑ Diaz, R. J., & Rosenberg, R. (2008). "Spreading dead zones and consequences for marine ecosystems". Science. 321(5891): 926–929.CS1 maint: multiple names: authors list (link)
- ↑ Gregg, W. W., Casey, N. W., and McClain, C. R. (2005). "Recent trends in global ocean chlorophyll". Geophys. Res. Lett. 32:L030606.CS1 maint: multiple names: authors list (link)
- ↑ 11.0 11.1 11.2 11.3 11.4 11.5 11.6 Dorgham, M. M. (2013). "Effects of eutrophication". Eutrophication: Causes, Consequences and Control: 29–44.
- ↑ Chislock, M. F., Doster, E., Zitomer, R. A. & Wilson, A. E. (2013). "Eutrophication:Causes, Consequences, and Controls in Aquatic Ecosystems". Nature Education Knowledge Project.CS1 maint: multiple names: authors list (link)
- ↑ Rabalais, N. N., Turner, R. E., Díaz, R. J., and Justic, D. (2009). "Global change ´ and eutrophication of coastal waters". ICES J. Mar. Sci. 66: 1528–1537 – via Limnology and Oceanography Bulletin (L&O Bulletin).CS1 maint: multiple names: authors list (link)
- ↑ Nørring N.P., Jørgensen E. (2009). Eutrophication and agriculture in Denmark: 20 years of experience and prospects for the future. pp. 65–70.
- ↑ Gren, I., Lindahl, O., & Lindqvist, M. (2008). "Values of mussel farming for combating eutrophication: An application to the Baltic Sea". Ecological Engineering. 35: 935–945.CS1 maint: multiple names: authors list (link)
- ↑ Laukkanen, M., Ekholm, P., Huhtala, A., Pitkänen, H., Kiirikki, M., Rantanen, P., & Inkala, A. (1 June 2009). "Integrating Ecological and Economic Modeling of Eutrophication: Toward Optimal Solutions for a Coastal Area Suffering from Sediment Release of Phosphorus". AMBIO: A Journal of the Human Environment. 38: 225–235.CS1 maint: multiple names: authors list (link)
- ↑ Duarte, C. M. (2009). "Coastal eutrophication research: a new awareness". EUTROPHICATION IN COASTAL ECOSYSTEMS. 629: 263–269.
- ↑ Marino. J., Lin, P., Karlova, N., & Eisenberg, M. (2011). "Avatar transparency and the establishment of trust in virtual information eco-systems". Association for Information Science & Technology.CS1 maint: multiple names: authors list (link)
- ↑ Karydis, M., Kitsiou, D. (2011). "Eutrophication and environmental policy in the Mediterranean Sea: a review". Environmental Monitoring and Assessment volume. 184: 4931–4984.CS1 maint: multiple names: authors list (link)
