Course:CPSC522/Predicting Affect of User's Interaction with an Intelligent Tutoring System
Predicting Affect of User's Interaction with an Intelligent Tutoring System
Principal Author:Md Abed Rahman
Intelligent Tutoring Systems or ITSs can be used to predict how the student or user feels; which can pave the way to creating systems that dynamically adapts to users needs.
This page is based on:
1. Modeling Learner Affect with Theoretically Grounded Dynamic Bayesian Networks[1]
2. Predicting Affect from Gaze Data During Interaction with an intelligent Tutoring System.[2]
Abstract
Emotions play a critical role when it comes to effective Learning. This makes development of pedagogical agents that detect, model and adapt to clues about users emotional states, an area which needs further attention.[3] Reliance on sensors in building such systems defeats the original purpose of making the user learn from the environment. This is due to the inherent obtrusive behavior of sensors attached to the user[i.e. distractions caused by such]. Thus it is imperative to develop more accurate models based on theoretical models of emotion[e.g. appraisal theory].[1] This page gives an overview on two such approaches that tries to predict user emotions based on theoretical models of emotions; using varied AI techniques. The first paper mostly uses Dynamic Bayesian Networks to model user emotions whereas the second paper uses various classifiers to for classifying emotions.
Background
There have been several attempts in solving the problem of predicting emotions related to learning. Many of them used various models to parametrize emotions with the help of various novel AI techniques. Some of them worked on the OCC model of emotions that recognizes 22 different emotions as part of its model. Some of these studies used some other well known model for representing emotions. One of such models is the model by Elliott and Pekrun.[4] This model formalized achievement emotions by focusing on positive or negative valences of such. This model was used in the first study[1] . On the other hand, the second study only took boredom and curiosity as representatives of the positive and negative spectrum of emotions and formulated it as a binary classification problem.This papers main contribution was generating meaningful feature sets from eye-gaze data which has been proved to be correlated to motivation in context of ITSs.[2] This study in many ways focuses on finding sources of unobtrusive features which is also one of the goals of such research.
Content
Modeling Learner Affect in a Learning Environment
As mentioned before, there has been various attempts to model user emotions in the context of ITSs. The idea is used to make the use of sensors minimal and to make the learning experience as unintrusive as possible. Here we give an overview of both of the studies along with some concepts that might be core to the research that has been done. We call the first study by Sabourin et. al as Crystal Island study and the second one by Conati et. al as MetaTutor study. This naming is based on the pedagogical environment they have worked on.
Crystal Island study
This model for predicting learner's emotions were built using data from the student's interaction with Crystal Island, a game based learning environment made for teaching students about various concepts of microbiology. The game revolves around the protagonist Alex, who is introduced to a newly discovered volcanic Island with a team of researchers who are there to explore the aforementioned Island. Alex is shown to be the daughter of the lead scientist. As member of the team starts getting ill, she is to find the cause and stop the outbreak. This game works on making the player go through tasks to impart knowledge on microbiology as they play. The demo version of the game is open to play which can be found here.
Methodology
The study includes data from 296 eighth grade students studying in a rural North Carolina middle school . After removing instances of incomplete or logging errors, data of 260 students were chosen.
Pre-study
The Pre-study was done a week prior to students start their interaction with Crystal Island. "The pre-study materials included a demographic survey, researcher-generated CRYSTAL ISLAND curriculum test, and several personality questionnaires".[1] Personality was judged based on the Big 5 personality Questionnaire which measures a students personality across the five following criteria: openness, conscientiousness, extraversion, agreeableness and neuroticism. Scores are usually shown in a percentile to show how many percentage of the population are in the same range as the test taker. Student approach or avoidance tendencies are the two criteria for judging .[5] Students’ affect regulation tendencies were also measured which was excluded from the model.
Study
Each participant were given 55 minutes to play the game i.e. to solve the mystery. Affect data was collected from the user by regular self-report prompts every seven minutes. The self report was to click a radio button that contains choices which signified emotional states relevant to learning. These states are: anxious, bored, confused, curious, excited, focused, and frustrated. Also, the students also had to write a few words about their currents status in the game. In total 1863 emotion reports were collected to find a baseline. This was done by setting the baseline accuracy to the percentage of instances of the most frequent class. Focused was the most frequent class with 22.4% self reports beingsuch. So a baseline accuracy of 22.4% were determined for emotion prediction and 54.5% for valence prediction[i.e. percentage of positive self reports].
-
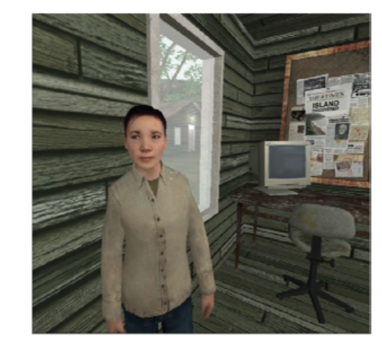 Crystal Island environment
 -
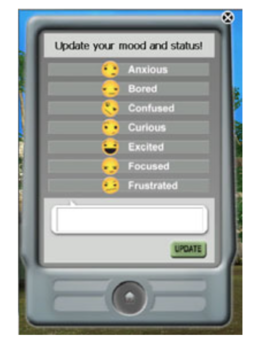 Self-report interface


Predictive Modeling and Naive Bayesian Network
To model the cognitive appraisal process, a Naive Bayesian Network was learned. This is reasonable since, there is inherent uncertainty in the emotion prediction process. Specification of the Bayesian Networks were acquired by using the GeNIe modeling environment developed by the Decision Systems Laboratory of the University of Pittsburgh (http://dsl.sis.pitt.edu). The probability distribution of the parameters of the model were learned using the EM algorithm provided within GeNIe. Training and tuning was done using 10- fold cross validation. The models had the following three types of variable:
- Personal Attribute: These were taken directly from the students scores on peronal surveys. Four attributes for goal orientation and three attributes expected to be relevant to the student's appraisal: conscientiousness, openness and agreeableness were chosen.
- Observable Environment Variables. These dynamic attributes provide a summary of important actions taken, such as TestsRun, BooksViewed, and GoalsCompleted. Information about how well the student is doing in the environment based on certain milestones, such as SuccessfulTest and WorksheetChecks are also provided in these attributes
- Appraisal Variables: Appraisal variables are the result of the student’s cognitive appraisal of many factors. [1]
The attributes were used to train a naïve Bayesian Network. This was done mostly to provide an additional baseline of comparison. A naïve Bayesian assumes that that all variables are directly related to the outcome variable but are conditionally independent of each other. Hence, it is called a naïve Bayesian network. The learned naïve Bayesian network achieved a predictive accuracy of 18.1% on emotion label and 51.2% on valence. Subsequently, a static and a dynamic bayesian network were learned to model the states with better precision.
Building a Static Bayesian Network
After, a baseline of comparison has been established, a Static Bayesian Network was learned. This was based on the Elliot and Pekrun’s model of learner emotions. [4]Various attributes along with their interaction with various goal orientations have been used in the model of the learned Static Bayesian Network. For example, students with approach orientations are expected to have generally more positive temperaments and emotional experiences than students with avoidance orientations. Similarly, personality traits such as agreeableness and openness are expected to contribute to an individual’s overall temperament.[1][5] Taking into account of all such interactions the following static bayesian network was learned:

The parameters of the model were learned using the EM algorithm as before.The Bayesian network was able to predict emotion labels with 25.5% accuracy and the valence of the emotional state with 66.8% accuracy. Both of these predictions are significantly better than the established most frequent baseline and the naïve Bayesian network (p<0.05). This comes as a indication that using a theoretical model of learner emotions leads to better performance. However, the simple Bayesian Network has no way of representing emotion changes over time and how they are connected to emotions at a certain time. For this, the model has been extended by learning a [dynamic Bayesian Network]
Building a Dynamic Bayesian Network
Dynamic Bayesian Network or DBN are extensions of Bayesian networks that represent changes in the model over time. Thus, the network at time is informed by the observations made by the network at time . A variety of representations of the DBN is based on the previous static Bayesian network. Of these, the model with the highest accuracy was able to predict emotional state with 32.6% accuracy and valence with 72.6% accuracy. The DBN chosen is as follows :

In the picture above, there is a dynamic link between emotion and valence; values of these two variables at time is informed by the motion and valence at time .
Results
Given the work done that has been described previously, the following tables show the results obtained:
-
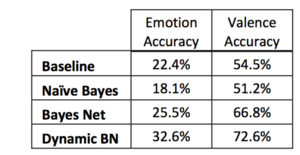 Predictive accuracies
 -
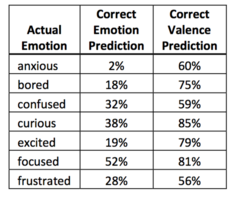 Predictive accuracy by emotion
 -
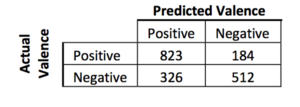 Valence confusion matrix


As expected, the predictive accuracy for focused, the most common self-report, was highest. This can be attributed to the high number of training examples. Anxiety, on the other hand, had the worst prediction with only 2% correct predictions. This again was due to low number of training examples for that particular emotion. Positive affective states were recognized 81.7% of the time whereas negative states were correctly identified with 61.1% accuracy. These specific accuracies are of interest for affect-learning systems as they are to respond to detected emotions. Again, this can also be shown that though the accuracies are usually bad in finding emotions of a certain kind[negative affective states were often confused for each other], the model does a good job when it comes to finding a certain spectrum of the emotional state[i.e. positive or negative].
MetaTutor Study
"MetaTutor is an adaptive ITS designed to encourage students to employ meta- cognitive SRL strategies, while teaching concepts about the human circulatory system". [2]MetaTutor is a self regulated learning system(SRL) which been shown to facilitate prediction of students’ learning gains and academic success. There are 4 pedagogical agents (PAs) which appear on the top right corner of the interface.[2]
The study data was collected from 67 undergraduate students with a variety of academic program concentrations. The selection of students were not necessarily in accordance with the content of MetaTutor. The participants used the MetaTutor, where they were recorded with a bunch of sensors, primarily the Tobii T60 eye tracker. Participants also self reported their concurrent emotions through an emotions- value questionnaire(EVQ). The questionnaire had questions which were answered on a 5-point Likert scale where 1 indicated “strongly disagree” and 5 indicated “strongly agree”. As mentioned before, the study only takes into account two of the most strongly reported emotions: boredom and curiosity which directly correlate with the positive and negative valence of the emotional spectrum.
Eye Tracking Data
Data for the aforementioned participants were taken.By discarding data of participants for whom too few valid gaze samples were recorded overall, 51 data points were acquired to build the dataset for training. EMDAT, an open source package for gaze data analysis, was used to process the data to find aggregate features. The feature set included application-independent features like number of fixations, fixation duration, saccade length etc. It also had features related to specific Areas of Interest (AOIs) within the MetaTutor interface. Taking into account the variability of features and how they are related to the training process, a total of 166 features were chosen.
Solving the emotion classification problem
The study focuses on curiosity and boredom detection. While in 18% of the self-reports both curiosity and boredom were rated to be present simultaneously, and in 13% of them, both were absent; they are taken to be mutually exclusive .Classification labels were based on the EV self-reports. Ratings of 3 or higher were labeled as Emotion Present (EP), and ratings of less than 3 were labeled as Emotion Absent (EA). For classification, the following four algorithms available in the WEKA data mining toolkit were used: Random Forests (RF), Naïve Bayes, Logistic Regression, and Support Vector Machines (SVM). A 10-fold Cross Validation(CV) was used to tune the parameters of the algorithms. Again, Principal Component Analysis (PCA) and Wrapper Feature Selection (WFS) was used for feature selection to make sure the classifiers don't overfit much. Since, WFS finds useful subsets of features which are more interpretable than PCA, the study focused on WFS .
Predicting Self-Reports Across the Interaction
To find the best classifier and also the optimal window length, a 4 (classifier) x 6 (window length) General Linear Models (GLM) was performed. The GLM results had no significant effects of classifier or interaction effects. It can simply be attributed to taking the best classifiers that works in practice to begin with. However, there was a significant main effect of window length for both boredom, , and curiosity, which significantly exceeded the baseline window. As a classifier, RFs seemed to work best. This can simply be attributed to its versatility as a classifier[Check this notes on Ensemble Methods]. The following graph shows values for which boredom and curiosity had the best results.

From the picture it is apparent that higher window length usually gives better accuracy. This behavior is easily explained by the fact that if window length is higher, so is the amount of gaze data collected. And we know, more data directly correlates to better performance.
Important Features
Features that were selected by the WFS process shows general trends that are depicted in the following figure:

Arrows indicate gaze transitions and circles indicate features related to the various gaze trends found. One particular trend of interest is that students who are engaged make frequent use of the table of contents (TOC). This kind of observations are backed by the fact that increased fixation length in the TOC and more TOC-to-TOC transfers are indication of curiosity in this regard. On the other hand, random gaze shift show that the user is not motivated enough.
Time-Dependent Effects on Prediction
Self-report time was also treated as its own classification problem, to see if this timing information can improve performance. A full 14- minute window for prediction was used which yielded the following results:

A 4 (classifier) x 4 (report time) General Linear Model was performed on the results., which are shown in Fig. 4. For boredom, there were no significant effects. For curiosity, a main effect of report time for both kappa and accuracy, , was found. This suggests that the time of the self-report, is strongly correlated with the relationship between gaze and affect.
Conclusion
Both studies give prospects of future works that can be done to extend what have already be done. The authors of Crystal Island study mention extending the work into other domains as a mean of generalization as prospect of future works.On the other hand,the authors of MetaTutor study think of using additional data sources collected during the MetaTutor study in order to predict affect. Once tractable and effective methods for detecting student affect are found; interventions that will help increase task success, engagement, and user satisfaction can be tailored to facilitate a better learning environment.
Annotated Bibliography
- ↑ 1.0 1.1 1.2 1.3 1.4 1.5 Modeling Learner Affect with Theoretically Grounded Dynamic Bayesian Networks- Jennifer Sabourin, Bradford Mott, James C. Lester
- ↑ 2.0 2.1 2.2 2.3 Predicting Affect from Gaze Data During Interaction with an intelligent Tutoring System- Natasha Jaques, Cristina Conati, Jason Harley, Roger Azevedo
- ↑ Aligning and Comapring Data on Emotions Experienced during Learining with MetaTutor-Jason M. Harley, Francois Bouchet, and Roger Azevado
- ↑ 4.0 4.1 Achievement goals and discrete achievement emotions: A theoretical model and prospective test- Pekrun, Reinhard; Elliot, Andrew J.; Maier, Markus A..
- ↑ 5.0 5.1 "Goal Orientation"
|
|