As we mentioned in the Hint 1, the graph of  is obtained by translating the graph of
  horizontally by
  . Note that the shape of the graph doesn't change under the translation.
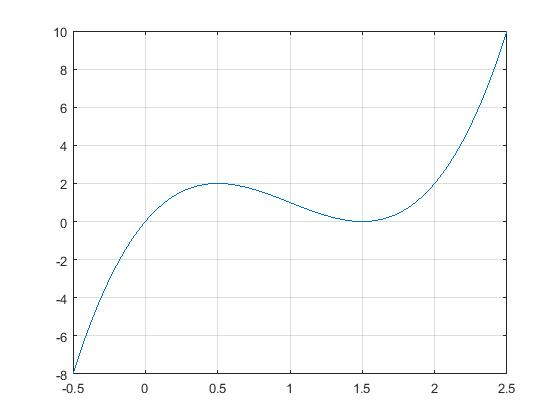
From part (a), we know that is strictly increasing on  , and strictly decreasing on
  . Also, has its maximum value
  at
at  and
and  . Based on this, we can draw the following graph of ;
From the graph we can easily see that if we move the graph of horizontally to the left (i.e.,p<0), the maximum occurs at , because of  for
for  . Therefore, for
  , the function
  has its maximum
  , so that
  .
.
On the other hand, for any  , we have
  and actually
  only occurs at in the range
  .
This implies that when we move the graph of horizontally to the right (i.e.,p>0), if
.
This implies that when we move the graph of horizontally to the right (i.e.,p>0), if  is in
is in ![{\displaystyle [0,2]}](https://wiki.ubc.ca/api/rest_v1/media/math/render/svg/120ef5837b0c64a40a2333f5aefd3c36fc458e91) , the maximum of is . Therefore, for
, the maximum of is . Therefore, for  , we get
  . (by part (a), when
  , we also have .
Furthermore, if we move the graph of horizontally to the right by  , (i.e,
  ), the graph is strictly increasing on , so that the maximum occurs at . As a result, for .
To sum, we have

.jpg)