Science:Math Exam Resources/Courses/MATH110/April 2011/Question 08 (f)/Solution 1
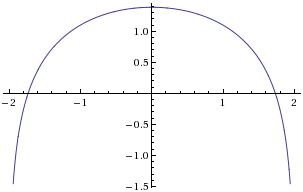
Using the information from parts (a) - (e), we draw the graph as follows.
First, we know that the function is undefined outside of so we will shade out that portion of the graph.
Now we add in the two x-intercepts at and . We also include the information about the asymptotes - both and were asymptotes, with the function going to .
Finally, incorporating the information from (d) and (e) about increase/decrease and concavity, and the maximum at x = 0, we connect the dots and finish the drawing.


