Science:Math Exam Resources/Courses/MATH104/December 2016/Question 08 (a)/Solution 1
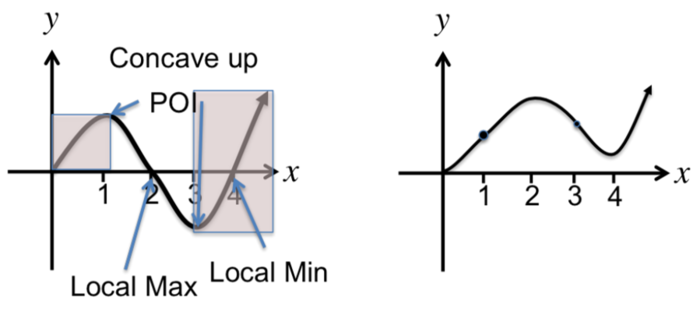
From the graph of , we can first see that , so that both are critical points; the candidates of the local extrema.
Since on , while on , is increasing on and decreasing on . This implies that is a local maximum and is a local minimum.
On the other hand, we observe that , and hence both are the candidates of inflection points. Indeed, this follows from that and are local extrema of and hence the critical points of .
Finally, the graph tells us that increases on the interval and , while it decreases on . This determines the sign of the second derivative of and hence the concavity of the function as follows;
Intervals Sign of Concavity Up Down Up
Since the sign of the second derivative is changing at both points and , they are inflection points of .
To summarize, we obtain a local maximum and a local minimum and two inflection points . Then, based on our observation, the graph of can be sketched as follows;


