Science:Math Exam Resources/Courses/MATH104/December 2016/Question 08 (a)
{{#incat:MER QGQ flag|{{#incat:MER QGH flag|{{#incat:MER QGS flag|}}}}}}
• Q1 (a) • Q1 (b) • Q2 (a) • Q2 (b) • Q3 (a) • Q3 (b) • Q4 (a) • Q4 (b) • Q5 (a) • Q5 (b) • Q6 (a) • Q6 (b) • Q7 (a) • Q7 (b) • Q8 (a) • Q8 (b) • Q9 (a) • Q9 (b) • Q9 (c) • Q10 • Q11 (a) • Q11 (b) • Q11 (c) • Q11 (d) • Q12 • Q13 •
Question 08 (a) |
|---|
|
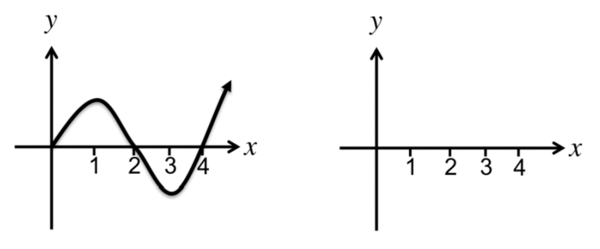
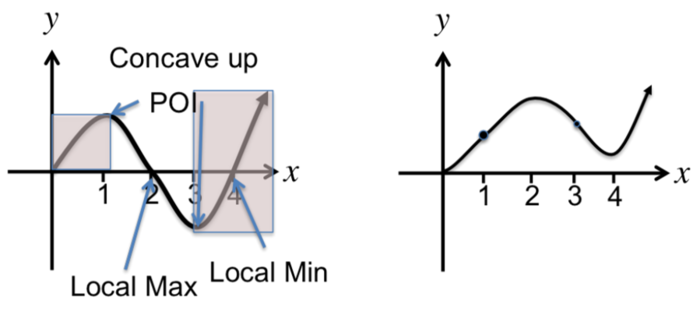
The graph on the left is the derivative of . Given that , sketch the graph of on the right grid. Clearly lable any local extrema and inflection points.  |
|
Make sure you understand the problem fully: What is the question asking you to do? Are there specific conditions or constraints that you should take note of? How will you know if your answer is correct from your work only? Can you rephrase the question in your own words in a way that makes sense to you? |
|
If you are stuck, check the hints below. Read the first one and consider it for a while. Does it give you a new idea on how to approach the problem? If so, try it! If after a while you are still stuck, go for the next hint. |
Hint 1 |
|---|
|
From the graph of , determine where is increasing or decreasing and concave up or down. |
Hint 2 |
|---|
|
Find the points satisfying and , which are the candidates of the local extrema and inflection points, respectively. |
|
Checking a solution serves two purposes: helping you if, after having used all the hints, you still are stuck on the problem; or if you have solved the problem and would like to check your work.
|
{{#incat:MER CT flag||
}}


