Science:Math Exam Resources/Courses/MATH102/December 2015/Question 18 (d)/Statement
A dangerous infectious disease spreads through Vancouver as described by the differential equation
where is the transmission rate constant, is the total population size (constant), is the recovery rate and is the number of infected individuals. Assume that .
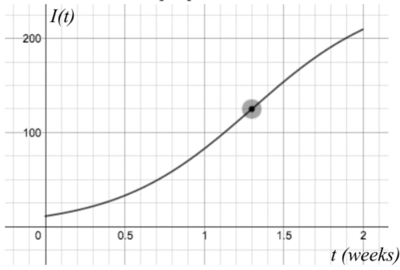
(d) By collecting data from local hospitals, you manage to plot the graph of number of infected individuals as a function of time from the onset of the epidemic until two weeks later. You notice an inflection point in the data and mark it with a black dot. What is the steady state number of infected people? Your answer should be a number.


