Science:Math Exam Resources/Courses/MATH100/December 2012/Question 06 (f)/Solution 1
Before assembling the graph, we will calculate the x-intercepts, found by setting the original function equal to zero and solving for x.
Factoring out gives:
So there is an x-intercept at
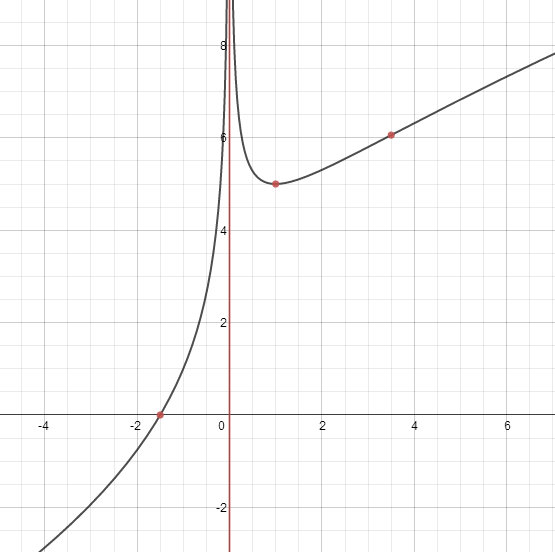
To draw the graph, we will start by plotting the vertical asymptote at x = 0 and various points: the x-intercept at , the minimum at and the inflection point at . Because the question asks for the y-coordinate of the minimum (from part b), we plug x = 1 into f(x) to get:
So our minimum will be the point . All this gives a picture that looks like this:
Using information from part a) about the intervals of increase and decrease, we know the graph should roughly look like this:
Finally, using part c), we know the function is concave up for and concave down otherwise, which leads us to the final graph:


