Garbology of UBCO
Introduction
Humans have created waste as long as they have existed, and it is impossible to discuss humans without discussing the objects that they have left behind. By examining waste, it becomes possible to study the history and patterns of humans; such is the practice known as garbology. Analysis of garbage can be a good indicator of what needs improvement as well as helping to determine the dominant traits and habits of those in the vicinity of receptacles.
Garbage is an ever present and unappealing part of our society. Often times it is easy to throw our trash out in receptacles for it to be taken away, both out of our sight and our minds, reducing the burden and concerns we often feel about contributing to global pollution. The first part of this project, which was conducted by the Anthropology 327 class between between the months of January to March of 2020, and was supervised by Professor Lindsay Der, groups of students collected garbage from various parts of UBC Okanagan and charted, classified, and analyzed waste into different categories. While odd and gross at times, the project was targeted at helping to better identify and describe the habits of individuals at the UBCO campus who had left the waste behind, as well as to gather information on garbage disposal practices and their links to mobility patterns and the availability of bins and signage in different buildings at UBCO.
The second part of the project gathered ethnographic data from the people at UBC Okanagan about their knowledge and thoughts of waste disposal through the means of an in-person enthographic survey designed by the ANTH 327 class. Each research team in the class conducted a minimum of 10 surveys, with at least two staff or faculty members being interviewed per research team. This section highlighted the areas related to waste disposal practices in need of improvement at UBCO, both in the physicality of the receptacles and in garbology education.
Within the UBC Okanagan campus, the buildings where the material collection and ethnography data collection were conducted included the: Arts (ART), Science (SCI), Arts and Science (ASC), Library (LIB), Engineering, Management and Education (EME), Administration (ADM), Sunshine Cafeteria (SCT), Commons (COM), Creative and Critical Studies (CCS), University Centre (UNC), Gymnasium (GYM), Reichwald Health Science (RHS) and Fipke (FIP) buildings.
Garbology of UBCO Project Team
- Lindsay Der (Supervisor), Department of Community, Culture and Global Studies
- Paulina Aksyonova (Student)
- Shaniya Anand (Student)
- Emily Avey (Student)
- Stephanie Awotwi-Pratt (Student)
- Caitlin Bergh (Student)
- Alicia Bondar (Student)
- Sarina Bouvier (Student)
- Shay Gilad (Student)
- Maddie Goepel (Student)
- Madeleine Hamilton (Student)
- Tyra Hollenzer (Student)
- Nicki Howard (Student)
- Viswanath Javvaji (Student)
- Nicole Joostema (Student)
- Rachel Kennedy (Student)
- Nyshaya Leck (Student)
- Evan Lundell-Creagh (Student)
- Michael Mandarino (Student)
- Camille Morissette (Student)
- Cheyenne Nelson (Student)
- Lauren Proctor (Student)
- Simone Schuster (Student)
- Gemma Spink (Student)
- Mikayla St Onge (Student)
- Hannah-Marie Thompson (Student)
- Maximilian Von Krosigk (Student)
- Shan Yeoh (Student)
- Rachael Yoo (Student)
Background
Our lives have long been represented by the items we discard. In the past, numerous studies have been conducted on the waste of past societies and more recently, our own. This section outlines the history of garbology and campus studies of waste disposal; displaying how effective garbology can be in the process of understanding human consumption patterns.
Garbology
For a long time, archaeologists and anthropologists have been studying the history of past cultures and civilizations through the process of garbology. This form of analysis has been an ongoing process at many different institutions since 1970 (Cote, McCullough and Reilly 1985:189). William Rathje is often considered as the “father” of academic garbology with his work conducted mainly at Stanford and the University of Arizona. Rathje began the Tuscon Garbage Project in 1973 as an academic study drawing on the archaeological and sociological realms (Rathje 1991). Through the excavation and examination of landfills, anthropologists can study the contents of the past as well as the decay rates of different objects (Damron-Martinez and Jackson 2017:152). For instance, plastic bottles can take up to 500 years to decay in a landfill (WWF 2018). Garbology is a way to analyze the consumption rates and patterns of different groups and societies, both in the past and present. Archaeologist have been able to study past societies to get a better understanding of modes of living and how they were organized. While this is done on a smaller scale than a landfill and in archaeological digs, it is possible through remains to analyze crucial aspects such as past diets (e.g. faunal remains and food scraps) (Dalal 2018).
It is often found that there is a discrepancy between a consumer’s self-reported waste disposal habits and their disposal behaviour; however, “garbage does not lie” (Damron-Martinez and Jackson 2017:153). We can learn a lot about different groups of people and societies through their waste disposal practices. Garbology shows how values change over time alongside ways of living (i.e. seeing an increase in plastic indicating more disposable goods). When consumers no longer need or want particular objects, they get thrown away, and this is when the process of garbology becomes involved (Benton 2015:117). Garbology highlights the discrepancy between what we think we know about our garbage and waste disposal habits and what we do know (Benton 2015:120). Our waste disposal reflects the story of our past and present. Garbology could also provide data for climate change advocacy as it illustrates the problematic consumption patterns and how it is done at an unsustainable scale. Thus, garbology brings to light complex issues such as landfill disposal, methane and greenhouse gas emissions, and the need for reusable goods. For instance, food scraps are responsible for a large portion of greenhouse gas emissions, which is tightly linked to the fact that a third of the food produced is thrown out or not consumed (Heller et al. 2018). Furthermore, it should be noted that many of the waste produced in the West, specifically recycling is shipped overseas, such as trash imports (Chappell 2002). Therefore, such measures further support the need to rethink both waste disposal and consumption rates. Overall, there seems to be a need to reconsider both the system alongside individual consumption patterns (Garnett 2014).
As stated by Damron-Martinez and Jackson, “we are what we throw away” (2017:152).
Campus Studies of Waste Disposal
There have been various studies concerning garbology conducted by universities globally. The article Toward Zero Waste Events: Reducing Contamination in Waste Streams with Volunteer Assistance written by Ivana Zelenika, Tara Moreau, and Jiaying Zhao describes a past study conducted at Arizona State University (2018). This study evaluated the effect of having volunteers placed at waste disposal bins during three baseball games that were hosted at the university (Zelenika et al. 2018). This study was conducted due to the lack of knowledge surrounding sorting accuracy (Zelenika et al. 2018). The authors identified that “studies have attempted to reduce waste contamination and motivate waste diversion with additional visual prompts such as 3D …and through games with immediate feedback to induce higher sorting accuracy” (Zelenika et al. 2018: 40). After identifying patterns and methods for improving sorting accuracy, Zelenika, Moreau, and Zhao identified a study conducted at the University of British Columbia that used volunteer displays, as well as 3-D prompts in an effort to improve sorting accuracy on the Vancouver campus (2018).
Garbology has been further studied at various universities as a means of understanding marketing strategies; this was evaluated in Datha Damron-Martinez and Katherine L. Jackson’s article, Connecting Consumer Behavior with Marketing Research Through Garbology. The article evaluated, “the varying levels of technology found at U.S. colleges and universities can be quite disparate, garbology offers a low-tech alternative to other research experiential learning experiences" (Damron-Martinez and Jackson 2017:153). After participating in activities like dumpster diving, students were better able to understand the connection between marketing and the consumer. The authors asserted that not only were students able to understand sorting accuracy, like in previous studies, but they were able to participate in the research and make connections to other disciplines. Further another study identified in Spring Breaks and Cigarette Tax Noncompliance: Evidence From a New York City College Sample, written by Kimberly Consroe, Marin Kurti, David Merriman, and Klaus von Lampe Dr.jur examined “the influence of migratory periods on the prevalence and nature of cigarette tax noncompliance, which encompasses tax avoidance and evasion, on a gated New York City college campus” (2016: 1774). By using garbology practices, such as looking through trash, researchers would be able to identify discarded cigarettes and thereby use them towards data in order to understand consumption patterns. Additionally, researches could further connect these patterns to their research of understanding cigarette tax noncompliance. Overall, this displays the importance of garbology when conducting various research on university campuses. Understanding human consumption through garbology can assist researchers in various disciplines.
Studies have also been conducted on the potential benefits campus waste could provide to both the University and the neighbouring community. A case study of the University of Cincinnati conducted by Tu, Zhu, and Macavoy evaluated the benefits of converting waste cooking oil to biodiesel, waste paper to fuel pellets, and food waste to biogas (2015:1). Results indicated that all three processes would significantly decrease waste on campus, reducing overall campus output. As well, these projects proved to be economically self-sustaining in the long run, with the payback periods ranging between 16 and 155 months (Ibid). Finally, emissions also decreased as "the reduction of GHG emission from the implementation of the three WTE projects was determined to be 9.37 (biodiesel), 260.49 (fuel pellets), and 11.36 (biogas) tonnes of CO2-eq per year, respectively." (Ibid). Using this study as a guide, as well as our own on the current habits of UBCO, recommendations may be made that include the adoption of these projects.
Edward Humes, in his book Garbology, inspired students at Arizona State to conduct a study where each student carried around their trash with them for two days ( Fahs, 2015: 30). The first two day period, students were instructed to produce the regular amount of waste they usually do. The second two-period day, students were asked to be mindful of their waste, producing as little as possible. Results indicate that the students became more self-aware of their waste practices after taking part in the study, leading to a potential change in future habits. ( Fahs, 2015: 33). Therefore, on-campus studies have been conducted in search of ways to reduce people's ecological footprint. It is beneficial to this study as we found that the majority of people were unaware of their waste habits
Objectives and Research Questions
Based on our initial findings across the University of British Columbia Okanagan Campus, we derived our key research questions to be:
- How well do individuals at the University of British Columbia Okanagan campus sort out their garbage and recycling, and to what extent are the members of the public aware of their surroundings when it comes to the availability and presence of bins and signage?
- Can we plot out a trend based on usage among the community to find any traits or patterns?
- Are there any effective methods of learning or education being used to help inform the public about proper waste recycling methods? If so, which?
Based on these 3 key questions, our study aims to develop and understand the habits among a variety of members of the University of British Columbia Okanagan community to help inform us and understand more effectively what goes around in terms of waste and their attention to detail. Each of the key research questions developed from issues that we as a class perceived to be the real issue within our community.
Objectives
Based on our research questions above, a set of defined and clear objectives could be formed to help elaborate on.
- General consensus around the community in University of British Columbia Okanagan shows that there is a limited sense of knowledge and understanding around the idea of recycling and proper waste disposal. Can we aim to prove such a problem and is it as widespread as initially envisioned?
- The level of sorting and overall accurate waste disposal is limited by issues in education and lack of consistency of bins. Can we prove such a problem using our data analysis?
- Many students and staff on the University of British Columbia Okanagan campus are generally concentrated around 3 key buildings; Library, Arts and Science. Can we correlate a study to show a difference between buildings most frequented versus buildings less frequented?
Based on the 3 key objectives and questions, our garbology study aims to showcase and help to elaborate on the problems seen around our campus and possible causes to such issues.
Methodologies
Methodologies are essential for the running of any research study. This Garbology study used two ways of collecting data to answer the research questions: Materials Analysis and Qualitative Surveys. The Materials Analysis methodology was conducted first and was the collection of trash from campus then sorting through it to collect data on the way the campus community sorts their trash. The Qualitative Survey was conducted second and acted as a follow up to the data we had collected from the Materials Analysis. The Qualitative Survey was conducted to see the self-reported trash habits of members of the campus community.
Materials Analysis
To understand the sorting habits of UBCO’s visitors and the effectiveness of our waste receptacles, the class examined the waste bins available on campus: garbage, recycling, compost, returnable, and e-waste. For the collection phase, students paired together and signed up for a specific time and location so students would not have overlapping schedules, and thus be able to collect an adequate amount of waste per pair. At a minimum, each pair was to collect 100 items. Furthermore, students were to record the location, the surrounding environment, rate of foot traffic, and whether the area posted UBCO's sorting infographics. Garbage was collected and stored by the students until the appointed sorting time. During the laboratory sorting session, the student pairs were responsible for correctly sorting their items. First, items were separated between the five categories: garbage, recycling, compost, returnable, and e-waste, before being tallied. Next, items within each group were separated into the pre-determined sub-categories. Garbage: Plastic Utensils, Food Wrappers, Contaminated Plastic, Plastic Food Containers, Plastic Bags, Contaminated Paper and Miscellaneous. Recycling: Paper Products, Paper Coffee Cups, Paper Coffee Lids, Coffee Sleeve, Miscellaneous, Plastic Cups and Plastic Containers. Compost: Food, Compostable Utensils, Tea Bags, Compostable Food Containers, Napkins/Paper Towels and Miscellaneous. Returnable: Plastic Bottles, Juice Boxes, and Cans. E-Waste: Batteries, Electrical Cords and Chargers. Each subcategory was also tallied. After sorting and tallying the items, each group disposed of the collected items in their respective bins on campus property. Finally, the class submitted and calculated all tallied items and categories online for quantitative comparison and analysis.
Limitations to Material Analysis
There are a few limitations to using Material Analysis with garbology, the first being the possibility to misinterpret which category waste items fall into. When working with discarded materials and having several different groups sorting them, there is a chance for individuals to misidentify what to categorize material as. Another limitation would be that groups collected the waste at different times and could have been heavily impacted by the timing of the custodial staff taking away the waste. This can lead to the materials being analyzed to show a biased representation of the waste that was disposed of.
Qualitative Surveys
In order to answer our research questions regarding knowledge and perceptions of garbage sorting practices by individuals at UBCO, the ANTH 327 class conducted in-person surveys throughout campus. The survey consisted of 20 items; the first five items were demographic questions filled out by the participant. For example, we were interested in knowing their age, how many years they have been affiliated with UBCO, and what department they are associated with. The remainder of the survey (15 items) was conducted verbally by the surveyor. The questions in this section were designed to reveal the participant’s level of knowledge surrounding waste disposal on campus – for example, “Which bins are found on campus?” and “Where do you think people at UBCO campus should put an empty paper coffee cup?”. We also asked questions regarding the participant’s levels of confusion and confidence surrounding their waste disposal practices. The data collected from the surveys was compared to data collected from the garbage samples to understand how perceived and actual waste practices differ on campus. Surveys were conducted in 15 buildings across campus by 15 groups of two surveyors, allowing an evenly distributed and diverse sample to be acquired. Each group was to obtain at least one staff member and one faculty member, and aim to have 10 surveys filled out.
Limitations to Qualitative Surveys
There are a few limitations to Qualitative Surveys, one of which is the level of honesty of the participants. As this study required the researchers to ask the participants all of the survey questions related to their own garbage practices and the garbage itself, there is the possibility that participants were not truthful in their answers to the questions which could potentially be due to trying to conform to social norms and what is accepted as good trash habits. Another limitation of qualitative surveys that has to be considered is that it is difficult to generalize the results to the population because of the small sample size, so there are many areas of the research study that cannot be attributed to the student population as a whole.
Results, Analysis and Interpretation
Garbage, recycled objects, returnable objects, compost and electronic waste (e-waste) were the main materials of the study. Samples of each were collected from various locations around campus as seen in the spatial comparisons. The data was analyzed as further discussed in the section through spatial comparison, sorting efficacy, real vs. perceived practices and types of objects discarded. The sorting efficacy was determined for each of the five categories of disposal. Again the results were analyzed further as discussed within the section. An ethnographic survey was conducted (n=146), by the members of the class, to obtain student, staff and faculty responses to knowledge and perceptions, of how to sort various items, and how well they think overall members of UBC Okanagan campus are effectively sorting their garbage. The data is discussed further in the real vs. perceived section. There were some interesting discrepancies in the reported levels of confusion and confidence among the survey participants, especially when compared to our observed material analysis. When looking at the types of objects discarded section, there will be graphs visually displaying which items were discarded as well as a further breakdown of organic vs. non-organic material, garbage, recycling, compost, returnables, and e-waste.
Spatial Comparison
Introduction:
Garbage culture on campus is essential to ensure that universities are pro-environmental and are teaching their students the values of proper waste disposal in order to form respectful and grateful attitudes among the students towards the environment. Garbage culture consists of many aspects such as education, creation of viable policies and effective enforcement of these policies; however, one of the aspects that is often overlooked is the convenience and accessibility of the proper waste disposal facilities in various locations on campus. In our Material Culture and ethnography sections of the projects, we, as a class, looked at and compared different campus locations for effectiveness of sorting, effective signage, accessibility, and the efficiency of the actual sorting as obtained from the physical analysis of the garbage in the Material Culture section of our experiment. Based on these observations we have concluded in which buildings the garbage receptacles are the most clear and convenient and are encouraging and facilitating proper waste disposal, and in which buildings waste is disposed of incorrectly and inefficiently. After that, we have analyzed the obtained data and looked deeper into the reasons that may have influenced the effectiveness of waste disposal practices in different locations, and discussed the ways to increase students' personal accountability for their own waste with the purpose of ultimately improving the garbage culture on campus. We have also discussed, based on our previous observations, which measures should be taken to facilitate such improvements.
Methodology:
In order to compare the spaces in which our investigation took place, we analyzed the compiled database of all the collected material culture and survey data. With respect to our collective database, we analyzed the consistency and frequency of sorting practices of UBCO community members within different buildings. In particular, we analyzed survey questions regarding participants' most frequented buildings, their knowledge of the waste facilities in these buildings, and their usage of these waste facilities. In focusing on survey questions of this kind, we were able to make conclusions regarding the spatial comparison of our material culture investigation, as our ethnographic data confirmed many of our initial findings from the material culture collection. Figure 1 was constructed according to answers given for the survey question concerning participant's building most frequented; Figure 2 was formulated according to answers given for the survey question regarding participants' frequency of sorting trash in different buildings; Figure 3 was constructed according to answers given for the survey question regarding participants' consistency of sorting practices; and Figure 4, which reveals the percentage of trash sorted properly and improperly in different buildings, was formulated according to our material culture collection from each building. The spatial comparison component of our garbology report, as informed by our material culture collection and ethnographic survey findings, is intended to reveal the current waste disposal practices by the UBCO community by investigating the waste data of different buildings on campus.
Ethnographic Data:
This study examined the sorting practices of participants based on the spatial location of people on UBC Okanagan campus regarding the reported confidence, consistency and usefulness of signage. We compared the sorting practices of less crowded buildings such as RHS, CCS, GYM and other buildings and locations on campus such as ART, EME, ADM, LIB, SCI, UNC, and the FIP building. The related findings are displayed in Figure 1. ART building had the most frequency of participants spending most of their time than all the other locations on campus and campus residence had the least amount of time spent by the participants of the survey.

The class was specifically interested in how effective the signage is on crowded and less crowded buildings and how this affected the confidence and consistency of sorting practices of trash at UBC Okanagan campus. Surveys were distributed to participants on the UBC Okanagan campus on February 10, 2020 between 12:30 and 2:00 PM, as well as on February 11, 2020, during similar times. The total class data percentages of each building comparing the level of consistency of sorting practices of the participants that filled out the survey at UBC Okanagan campus were also assessed. The graph of the frequency of participants' time spent in each building at UBC Okanagan launched further exploration into whether participants were successful at sorting garbage because they spent more time in the building locations at UBC Okanagan campus (Figure 1).
The graph displayed in Figure 2 shows the total number of participants that responded to the frequency of sorting trash, recycling and compost rated from every time, sometimes, and never at UBC Okanagan campus. The graph also uncovered that SCI had more confident participants with their sorting practices as confident every time. However, overall, the ART building had the least confident participants with the most respondents stating that they are never confident with sorting garbage at UBC Okanagan campus.

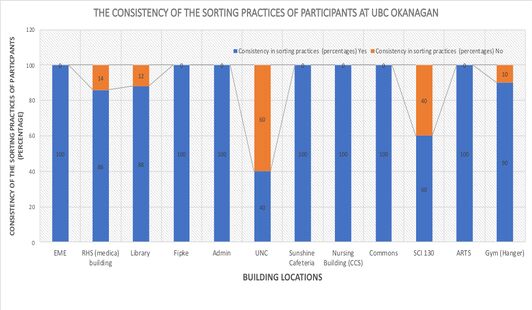
Figure 3 also reveals the total class data percentages of each building comparing the level of consistency of sorting practices of the participants that filled the survey at UBC Okanagan campus. The graph reveals that the UNC building had the most inconsistent sorting practices documented by the participants in the survey and the EME, ART, FIP, Admin, CCS, SCI, and the COM building had all of the participants state that they were consistent in their sorting practices at UBC Okanagan campus.
Sorting Data:
The research study also accounted for the patterns that participants displayed dependent on the building whether they were consistent and confident in their sorting practices. William Rathje and Cullen Murphy indicate that when comparing perceptions of sorting garbage and the actual results and response to questions determined, that participants tend to be “unreliable sources of quantitative and qualitative information” that reflect their behaviour, and in this case sorting trash at UBC Okanagan campus (Rathje and Murphy 1992: 67). Therefore, this insight is relevant to analyze how participants' perceptions of their abilities to sort does not necessarily translate to whether participants are knowledgeable about how to sort their garbage. However, with this knowledge, the RHS, CCS, and GYM buildings had consistent data that reflected the confidence and consistency of the sorting practices of those buildings in comparison to the rest of the Okanagan campus.
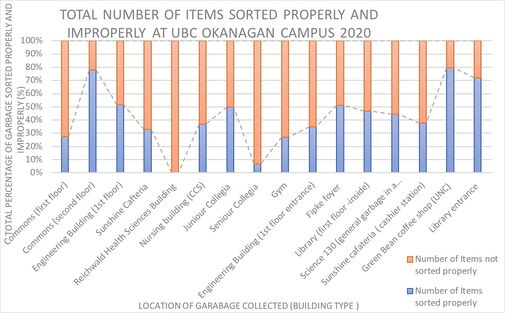
Figure 4 shows the total percentage of garbage sorted properly and improperly for each building at UBC Okanagan campus in 2020. Second floor COM, contrastingly, has the most garbage sorted properly, and the RHS building has the least properly sorted garbage. Figure 5 also displays a map of the 2020 campus garbage collection sites. The location circled in green, COM building, had the most garbage sorted properly and the red circle shows the RHS building which had the least amount of garbage that was sorted properly. The other locations circled in yellow had moderate amounts of garbage sorted correctly, including ART, ASC, EME, ADM, LIB, SCI, CCS,UNC,FIP, and the GYM.

Of the sorting practices collected from students in different locations at UBC Okanagan campus, overall, second floor COM had the most garbage sorted properly, and the RHS building had the least properly sorted garbage out of all of the building locations at UBC Okanagan. The graph also reveals that the RHS building had the least amount of garbage sorted properly overall as compared to the other garbage sites on campus; second-floor COM had the most garbage sorted properly, this could also be because of the visible receptacles and signage over their garbages, making students more aware of sorting practices on UBC Okanagan campus, and since UBC Okanagan campus is the main site for most faculties such as nursing students, there would be fewer discrepancies in their sorting. Not only was the garbage in the RHS building sorted improperly, but the majority of the garbage was plastic (plastic wrappers) and discarded in the garbage and or recycling. Overall, the 2020 data revealed that students at UBC Okanagan had the most garbage sorted properly at second floor COM, while the RHS building had the least properly sorted garbage.
Conclusion:
The data from this study suggests that while participants considered themselves to be both consistent and accurate in their sorting practices, the actual makeup of waste on campus was sorted improperly more often than properly. While the least frequented buildings (RHS building, CCS building, and the GYM) were the most confident in their sorting practices, they were found to have some of the worst sorting practices on campus. The RHS building was one of the least frequented buildings on campus but had the lowest proportion of properly sorted trash than any other building. These findings regarding the sorting practices of less frequented buildings could be because there are fewer people, there is less waste, so the sample was not as representative as samples from other buildings. However, the Commons building, which is tied for least frequented with residence buildings, exhibited the highest rate of properly sorted trash. The participants from the commons building were also highly confident and consistent in their sorting practices which is consistent with the responses from other less frequented buildings. The majority of buildings on campus had moderate amounts of trash sorted properly, with the RHS building and the Commons building being the outliers. The results from this study could be skewed by the fact that our sample was only collected on one day during a short period of time. Samples from different times or days could result in different findings. Future research could explore the waste practices on the UBCO campus over a longer period of time which could result in more concrete findings. Nevertheless, these findings are important because they show which buildings were the best and worst with respect to proper waste disposal practices. Perhaps if we examined the factors that contributed to the exceptional sorting practices in the Commons, we could apply them to other buildings to ensure that UBCO remains environmentally sustainable and does not contribute to irresponsible waste disposal practices.
Sorting Efficacy

Methodology
In order to examine how effectively waste was being sorted and disposed of on the UBCO campus, the amalgamated data from every student team was consolidated and divided between the ethnographic and material analysis portions of the research project. For the ethnographic part of the study, participants were asked a series of questions about where they believed certain types of waste should go, which showed how effectively they were sorting their own waste and also highlighted any gaps in their knowledge of current waste disposal guidelines. For the material analysis portion, waste was collected across campus (Figure 5) and the type of waste found in each receptacle was categorized, with an overall percentage given as to whether it was correctly or incorrectly sorted for that bin type.
Ethnographic Data
The ethnographic part of the study focused on surveying various students, staff, and faculty across campus and asking them a series of questions. For the purpose of defining the efficacy of their sorting, the portion that will be focused on here is the testing section that asked them to sort different types of waste: a paper coffee cup, used tea bag, and a wooden utensil, and whether they would dispose of each item in the garbage, recycling, returnables, compost, or e-waste bin.
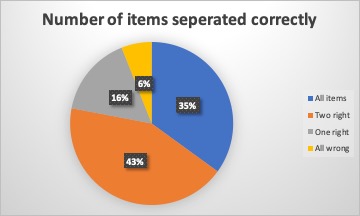
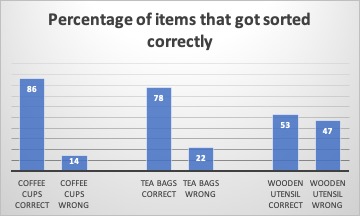
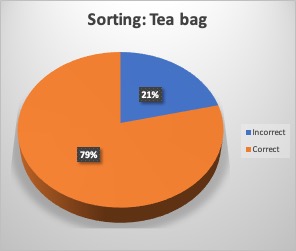
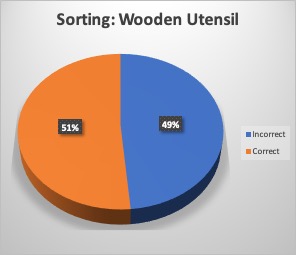
A total of 147 participants were surveyed, but the following results only account for 146 responses because one survey was spoiled. Figure 6 shows the distribution of correct answers to the three sorting questions: 35% got every question right, 43% got two, 16% only got one, and 6% got none correct. Figure 7 breaks this down further and reveals the correct and incorrect answers for each question itself. The coffee cup was the most effectively sorted by respondents, with 86% correctly sorting it into the recycling, and only 14% sorting it elsewhere. The tea bags were the second most effectively sorted, with 78% correctly choosing the compost bin, and 22% sorting it elsewhere. Lastly, the wooden utensil was a near even split, with 53% of participants correctly sorting it into the compost as well, and 47% incorrectly sorting it elsewhere.

Sorting Data
For the material analysis component of the project, waste was collected across campus from the FIPKE, CCS, Sunshine Cafe, EME, RHS, Junior Collegiate, Senior Collegiate, Arts, Gym, Library, Science, and UNC buildings. The waste samples were then sorted by bin type and their contents further categorized, both to get an idea of what waste was being disposed of and how accurately it was being sorted into the appropriate bins. The following statistics are averages for all the samples collected across campus, broken down by bin type.
When the garbage was analyzed, shown in Figure 8, only 20% of the materials sorted through were actual garbage, according to the UBCO sorting guide. 32% was compost, 45% was recyclable material, and 3% were returnables (such as beverage bottles). By comparison, the recycling bin was 58% actual recycling, 35% compost, 4% garbage, and 3% returnables (Figure 9). The returnables bin was 35% returnable items, 55% recyclable material, 3% garbage, and 7% compost. However, it is important to note that only two teams reported on the contents of the returnable bins so the results could be impacted by that. The e-waste bin was 100% e-waste, but like with the previous bin this data could be skewed because only one team reported on e-waste, and they sampled from one collection location.
In regard to the compost bins, no team collected samples from them so there is no data for this particular bin type or the breakdowns of its contents.
Conclusion
When the sorting efficacy is examined by the type object and bins, trends begin to emerge from the data. For the ethnographic portion, the majority of respondents correctly sorted the paper coffee cup and tea bag, but the wooden utensil caused the most confusion with nearly an even split between sorting it correctly and incorrectly. In terms of the bins themselves, the biggest issues were high levels of compost and recyclable material being sorted into the garbage bins, and high levels of compost found in the recycling, even though the amount of correctly sorted waste in the recycling was almost triple that of the garbage.
Real vs. Perceived Behaviours and Practices

Summary:
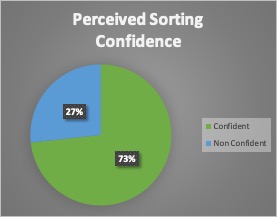
People tend to overestimate their own proficiency when it comes to properly disposing of trash. The specific question relating to survey participant confidence was question 12: "How confident are you in your proper waste disposal practices?" The available answers were "confident" or "not confident". 107 survey responses marked themselves as confident, and 39 reported being not confident. However, question 10 of the survey, which asked survey participants how confused they were about sorting waste, had 90 participants report confusion, while 56 reported not being confused. It is difficult to understand how someone can be both confused about waste sorting yet confident in their own ability to do so. Other questions in the survey gathered information on how aware the survey participant was of nearby trash receptacles, how they would sort certain objects, and how well they thought the members of UBC Okanagan's campus were doing at sorting their trash. Overall, participants in the ethnographic survey reported high levels of confidence in their own waste sorting and disposal practices. This is at odds with the observed frequency of properly sorted waste (see the above section). This discrepancy between perceived and actual waste disposal is backed up by earlier garbology studies.[1]
Comparison with the Tucson Garbage Project
The Tucson Garbage Project by William Rathje is something that was frequently referenced in the process of doing our garbology study at UBCO and this is because it has a lot of similarities in execution, as it is one of the most prominent garbology studies to this date.
Behavior in the Tucson Garbage Project vs. UBCO
The findings in the Tucson Garbage project varied significantly from the expectations. There were a lot of qualitative facts found out from the study such as things bout the alcohol consumption of the people. In our study we chose to look at the actual garbage habits based on what was in the bins. As it turned out many people don’t consciously recycle properly and from the surveys people think that they know the proper procedures when they do not.
Types of Objects Disposed
Introduction:
In this section of the report, we will visually represent which items are the most frequently discarded at the UBC-O campus. We will do this by displaying graphs that show how much organic material and non-organic material is disposed of, as well as the particulars of what is disposed of in the garbage, recycling, compost, returnables, and the electronic waste. The typologies of items per category had already been predetermined in class and therefore will be representative of the entire class' findings during their data collections and experiments. This is important for UBC-O Community to understand because it can be used to determine which items are used most and implement a sorting system with those items in mind.
Types of Objects Being Discarded Data:

In Figure 14, we separated all the waste collected by the class into two categories: organic waste and non-organic waste. As seen on the graph to the left, there are 1710 items that were organic and 1292 items that were non-organic. This equates to 57% of waste disposed on campus to be made of organic material and 43% of waste disposed on campus to be made of non-organic material.
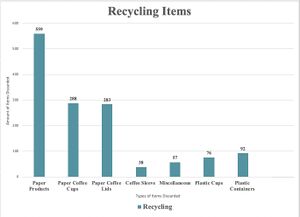
In Figure 15, we can see a greater breakdown of the recycling items that were disposed of on campus. These categories were predetermined in class to further represent the entire class's findings when they reported the materials that were found. As seen on the graph to the right, paper products were the most heavily reported item being 40% of all recycling across campus. This is followed by 21% being paper coffee cups and 20% being paper coffee lids. Also, 7% of recycling was plastic containers, 5% were plastic cups, 3% were coffee sleeves, and 4% were miscellaneous items. From these numbers, we can determined that most recycling items used at UBC-O are associated with coffee-related products.


In Figure 16, we are able to visually represent the items found in the compost bins across campus according to the subcategories agreed upon in class. As seen on the graph to the left, the napkins/paper towels category has the most significant portion with 49% of all compost. Behind that, 25% of compost materials were food items, 11% being compostable utensils, 10% being compostable food containers, 4% being tea bags, and 1% being miscellaneous items. These results show that the napkins/paper towels category is the most significant product found in recycling, which may suggest that plenty of people use napkins/paper products while eating and then throw them out with their food.
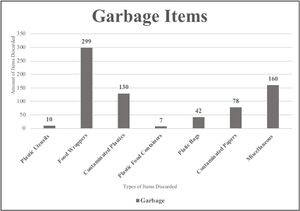
In Figure 17, we are able to see the 7 subcategories that make up the main category of "garbage", all of which were predetermined in class. As seen on the graph to the right, the most frequently discovered items were food wrappers at 41%. Following food wrappers, 22% of garbage were miscellaneous items, 18% were contained plastics, 11% were contained papers, 6% were plastic bags, 1% were plastic utensils, and 1% were plastic food containers. These numbers suggest that majority of items found in the garbage actually belong in other receptacle categories, if they were to have been properly washed after being contaminated.
In Figure 18, we are able to see the visual representation of the 3 subcategories of "returnables" that were predetermined in class. As seen on the graph to the left, there were a total of 193 items, with 64% being returnables being cans, 31% being plastic bottles, and 5% being juice boxes. Overall, this graph shows that there is little confusion with items being disposed of in the returnable bins, since there were no miscellaneous items found and little variation between subcategories.
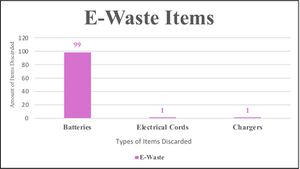
In Figure 19, we are able to see the 3 subcategories of "electronic waste" that were predetermined in class. Overall, there were 101 items with 98% of those being batteries, 1% being electrical cords, and 1% being chargers. This shows that almost every item disposed of in the electronic waste bins were batteries, therefore is the most clearly understood and marked item in this receptacle category.
Summary:
This section of the report visually portrayed the types of items discarded by the UBC-O Community, specifically students, staff, faculty, and visitors. Six graphs were displayed throughout the section, each one with a brief description and analysis. These figures looked at types of items discarded within recycling, compost, garbage, returnable and electronic waste (e-waste). The typologies and categories were previously agreed on by the research members and are more specifically shown through the graphs above. It was found that garbage, recycling and compost had the most amount of items as well as types of objects. Meanwhile, returnables and e-waste had the least amount of types as well as items. These findings may be due to overall high volumes of garbage, recycling and compost bins as opposed to low quantities of returnables and e-waste bins across campus.
Garbology at UBCO over Time
When comparing the studies performed in both 2019 and 2020 it is nearly impossible to do a direct cross examination of data. This complication comes from the differing objectives each year had towards the collection of UBCO waste materials.
Some of the common objectives observed in 2019’s reports show a greater emphasis on analyzing waste materials as artifacts, or objects with entrenched meaning. Many of the reports had very niche research questions ranging from the chemical content (caffeine or alcohol) associated with waste materials, to the form of label found on artifacts. Very little emphasis was placed on the full spectrum of sorting categories found on the UBCO’s campus, even omitting the existence of Returnable, E-waste, and wash stations. The intent of 2019’s results overall were to catalogue waste materials in depth and relate them to the intent of the artifact’s consumption and mobility. These reports spoke more to the functionality of the artifact and how that functionality relates to the population of the UBCO campus.
However, when looking at 2020’s data sets it becomes apparent that an overarching general theme was established. This contrasts the individualistic approach of the previous year. This theme revolved around the effectiveness of sorting procedures on UBCO’s campus, and the subsequent connections these sorting practices have on sustainability and environmental awareness. The data of waste materials collected in 2020 were used as tools to determine people’s attitudes towards the accessibility and ease of waste receptacles. Rather than looking at waste materials as artifacts with inherent information, the observation of waste categories assisted in understanding the behavioural habits of the general UBCO majority. In 2020 there are 11 200 people that attend the University of British Columbia Okanagan campus,[2] this number includes staff and faculty, but it does not take into consideration the people who visit the campus.
Analyzing Both Data Sets:
Comparing last year's report to this year’s report, suggests people did a better job sorting last year than this year. Do keep in mind that in 2019 the only categories of sorting considered were garbage, recycling, compost and returnables while in 2020 E-waste was added, with additional consideration given to waste wash stations. In 2020 63% of garbage in the nursing building was not sorted properly, in 2019 45% of garbage in the nursing building was sorted improperly. That is an increase of 18% in just one building. In 2020 72% of garbage thrown away in the gym was not sorted properly, and in 2019 only 13% was not sorted properly, this is the biggest difference out of all the other buildings. The EME building in 2020 had 65% of garbage sorted improperly and in 2019 59% of garbage thrown out was sorted improperly. The library first floor was the only category that went down, in 2020 53% was in the wrong bin, and in 2019 70% was in the wrong bin. FIPKE in 2020 had 50% wrong and in 2019 only 30% was sorted wrong. Overall sorting proficiency has decreased in the past year. This understanding leads to the question, what has changed between 2019 and 2020? A trend that was seen in both studies was that people were throwing more items in the garbage than any other bin. In the garbage there were items that could have been recycled or thrown in the compost. From these two data sets it can be determined that sorting procedures are not natural habits the members of the UBCO community choose to maintain.
Differences in Procedure:
There was a significant difference in the research procedures between the two years. That is, in 2020, an ethnographic portion of the study was added. In this survey members of the UBCO community were asked to share their perspectives on the efficiency of sorting procedures. This survey was used to compare with the physical data previously collected. One of the many questions specified individual's reasons for not sorting. The most common reasons were: confusion over bin requirements, they were in a rush, and they had been to lazy. Though an ethnography was not included in the 2019 study, many researches inferred similar reasoning behind mis-sorted items. In 2019 a greater emphasis on the labels that were on the artifacts, this year although there was some mention of waste materials as artifacts, it was not something extensively recorded. Another difference is that 2019 a great number of outside bins were chosen, while tin 2020, outside bins were not considered. This would have made for a more well rounded study in 2020 as activities that can only be done outside produce a new variety of waste categories; for instance a large quantity of cigarettes butts were found in an outside garbage in 2019.
Items Thrown Away:
Much of the items thrown away in 2019 were the same as 2020. The most common items being coffee cups, their lids and sleeves, Tim Hortons wrappers, food containers, straws, and napkins. One group in 2019, as previously specified, had a lot of cigarette related items, while in 2020 cigarette butts were not seen - likely due to the lack of outside bins recorded. In 2019 some groups decided to focus on specific waste items, disregarding the rest of the waste collected, thus skewing the overall results. For example, one group in 2019 just collected bottles and cans. Overall the majority of what was thrown out in both years were food or drink related items.
Suggestions to Improve Waste Disposal in Previous Years:
The recommendations to improve people's sorting methods from 2019 are similar to what researchers had discovered in 2020. The most frequent recommendations were: better signage, a list of what can be put in what bin (to diminish confusion), and better pictures (making them bigger and clearer). The signs have remained the same between both years and are apart of the waste sorting initiative implemented in 2018. Last year there was a concern with the composting system put in place, this ties in with this year's idea of having the same bins around campus and having all the different types of bins side by side. This is also something that has not changed, despite people's requests for improved bin consistency. Another chance at improving waste at UBCO is enforcing the rules of what goes in each bin. Some recommendations from the 2020 ethnography are: animated garbage cans that cheered when waste is sorted properly and booed when sorted improperly, there was also the recommendation of charging individuals a small fee if they sorted improperly. Both years also noted the general lack of accountability there was for people who threw out trash, which could be solved by the suggestions above.
Previous Garbage Audits:
The garbage audit performed in 2018 on the UBC Okanagan campus showed what materials people threw away the most and in what bin those materials were found. In the recycling bin 38% of what was disposed of were paper cups, then the next largest category was cardboard/boxes at 20% recycled materials. In the garbage bins the largest quantity of materials thrown away was 34% paper towel/ Napkins, closely followed by 21% being paper cups. In the returnables bin 81% of what was disposed of was correctly refundable cans and bottles. Similarly in compost, 90% of the materials were organic food waste.
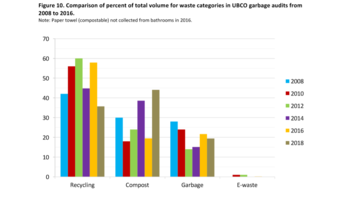
In the subsequent audits released by the University of British Columbia Okanagan similar trends of unsatisfactory sorting procedures can be observed all the way back to 2008.[2] By viewing the graph in figure 20 it may be observed that people used recycling less in 2018 than any year prior, this is supported by the audits finding that 21% of garbage was paper cups. This data is reflected in the most recent findings in our 2020 class research.
Even though recycling percentages have decrease there is still a larger quantity of material placed the recycling bins than disposed of in garbage containers. Composting has increased in usage significantly since the first audit in 2008.
Recommendations
Introduction:
Through a comprehensive analysis of class data, a trash problem at UBCO has been established on both a policy level and an individual level. Inferences were made from the raw data, further informing useful recommendations on improving sorting efficacy on campus. Analyzing the reasons for participants confusion has allowed us to disclose which improvements would be most beneficial to improving disposal behaviour. Participants recognized bin-types more than they were able to correctly locate bin-types. This is important because it informs us that recognizing bins does not accurately translate into locating, using, or having sorting knowledge of bins. These faulty behavioural trends exist from combined multifactorial inadequacies; such as, defective bin placement, signage variations, lack of knowledge, and policy inconsistencies. Altogether, the patterns identified in our analysis are important because they inform us that the problem lies in the first steps of sorting: recognizing and locating. This is also significant because understanding which demographic is best at sorting, and for which reasons, can allow us to apply those variables consistently across campus and promote proper sorting behaviour. In all, disposal patterns suggest that policy reform is needed at UBCO to enhance effective disposal and sorting behaviours. Several recommendations will be suggested in order to improve disposal accordingly.
Signage and Consistency
One of the main recommendation is regarding signage for improving consistency. Particularly, implementation of the same bin types alongside consistent signage in every disposal area of the building would greatly improve disposal behaviours and accuracy. The trash problem at UBCO can be largely attributed to the disjointedness between independent, provincial, and institutional levels. Bins, signage and sorting criteria on campus should be consistent with off-campus resources. Furthermore, British Columbia provincial policy must acknowledge and implement disposal standardization in order to promote effective sorting procedures.
Sign Consistency
UBCO currently fails to provide consistent tools and resources within and across campus. Students are attributing their ineffective sorting behaviours to inconsistent criteria, signage and bin placement across campus. Thus, UBCO should re-evaluate and develop consistency across campus regarding sorting information and resources. For instance, most participants who answered the question about consistency in the survey agreed that consistency across campus is needed to ensure proper disposal. Likewise, when asked if signage was useful most participants responded that it was. Only a small percentage of participants in the survey said no improvement was needed. Mostly signage was seen as useful and perceived to not need improvement. However, consistency on signage across campus would majorly improve sorting efficacy across UBCO campus for several reasons.
Bin Type Consistency
Faculty and students had issues locating bin types on campus. Specifically, many participants seemed confused about the locations of bins or were not aware some bin categories existed such as compost and e-waste. As a result, having consistency across campus would improve the locating accuracy. Consistency would instigate familiarity and make for easier locating, which in turn, would promote more effective disposal.
As an example, many participants attributed their confusion about proper sorting to unclear and/or lack or signage. Signage across campus is inconsistent in colour, symbols, content and position; let alone being consistently present. Furthermore, our analysis suggested that many individuals did not sort properly because of confusion surrounding bin-type inconsistency. Bins are often full and/or inconsistently present throughout campus. Every sorting station should have the same bins in the same position. Bins that are placed consistently are better recognized, properly located and better sorted, such as recycling. Bins that are not consistently present throughout campus, such as compost, are less familiarized to efficient sorting behaviours regarding that bin (i.e. compost items such as the wooden utensil were the least well sorted and participants were most hesitant when sorting this item).
Additionally, without bin consistency individuals are not given the option to dispose of something properly if the bin type is not present. This demonstrates why all bin types need to be consistently placed around campus. This also explains how un-familiarization with compost bins contributes to increasing amounts of confusion surrounding food and food-contaminated disposal. Again, consistency will allow for familiarization and the practicing of effective sorting habits.
Consistency beyond campus
In regard to consistency, we also recommend there should be more clarity surrounding consistent sorting across environments. For instance, participants were very confused about recycling because items often include multiple and varying materials, which can be considered recyclable in some environments but not others. For instance, the lining of coffee cups is said to be non-recyclable in external settings, but yet across UBCO they are. Thus, having consistency would greatly reduce such confusion.
Placement of Bins
Students primarily neglect sorting properly because of time constraints (e.g. it is time consuming, individuals feel rushed, in a hurry, too busy, and bins are placed in a crowded area). Universities endorse fast-paced environments and when bins and signs are inconsistently distributed and subject to high traffic areas, the majority of people who are not well-informed about proper waste disposal are unequipped to make quick categorical decisions. Thus, bins should be strategically placed in transitioning areas that are open and low in traffic to avoid rushed and inaccurate disposal.
Wash Stations
People are simultaneously not sorting because it can be gross and because they are confused about food disposal and food contaminated items. To help motivate and enlighten individuals on efficient trash disposal, UBCO should implement more wash stations and provide more information on current wash station locations. Tulane College in New Orleans has implemented the OZZI Program, in which containers are washed in order to facilitate re-usability.[3] Similarly, UBCO could implement a container washing program that would allow people to either re-use the item or dispose of it properly, without being contaminated by food. Altogether, the introduction of a container cleaner or cup cleaner could promote less items being thrown in the trash because of confusion surrounding food contaminated items.
Other Waste Strategies
Another way to promote familiarity and proper disposal categories could be achieved through campus-wide introduction of proper waste (i.e. education about bin types that exist on campus). With this in mind, the goal should be to educate students and staff on campus about the impact of improper disposal. Ignorance about where trash ends up plays a detrimental role around improper waste disposal and could greatly be reduced by implementing education about waste strategies and waste in general. For instance, during orientation week students should be taught university sorting policies, as many students attribute their confusion to lack of knowledge, being poorly educated, and inconsistency between campus and off-campus sorting policies. Further, in order to facilitate effective sorting as an engaging experience, bins could light up or give encouraging words upon proper disposal. As many students said they did not sort because of mere laziness, such engaging experiences may serve as encouragement for sorting effectively. Moreover, although some of the new high bins (e.g. in the commons) are promoting effective sorting for many students, they have not only discouraged effective sorting and accessibility but have neglected peers in wheelchairs. In the future UBCO should consider alternative constructions of bins, such as an opening on the side so that it is accessible to everyone on campus.
Conclusion:
Overall, our findings indicate that many individuals believe consistency of bin types across campus would improve disposal behaviours. Therefore, potential solutions include: campus implementation of the same bin types and consistent signage/graphics in every building. These efforts endorse familiarity, which promotes replication of effective sorting behaviours. As an example, recycling is in every building which has made it more identifiable and in turn, resulted in the most properly sorted bin-type. Therefore, having consistency everywhere on campus would make it easier for people to properly locate and use bins. Moreover, our results indicated many individuals did not properly sort because of confusion and feeling rushed. As a solution, bins should be placed in low-traffic areas and transitioning time between classes could be extended to ease the confusion that exists about how to sort items, as it allows people to have the time to make well-informed decisions from the resources provided (i.e. signage).
Conclusion and Future Research
This study was completed in order to find out patterns of humans at UBCO and to identify the needs of improvement of waste disposal practices at UBCO. Through the lengthy process of material analysis which included categorization, tabulation of data and extrapolating that data, as well as ethnographic research, which included in-person interviews, the results of this study are as shown on this page. In a general perspective, it is clear that there are still many individuals who are confused by the waste disposal practices at UBCO, whether it be because of the physical receptacles being unclear, or being unsure of where each item belongs.
According to the data collected, individuals at the UBCO campus, despite considering themselves to be both consistent and accurate in their sorting practices, most participants incorrectly sorted waste on campus. Furthermore, while the least frequented buildings (RHS building, CCS building, and the GYM) were shown to be the most confident in their sorting practices during the ethnographic survey portion of the project, they were found to have some of the worst sorting practices on campus, with the RHS building having the highest number of mis-sorted items in a building. On the other hand, the Commons building not only exhibited the highest rate of properly sorted trash but participants surveyed from the commons building were also confident and consistent in their sorting practices. Most individuals were the most confused by compost and recycling practices, which had the highest number of mis-sorted waste. This confusion was largely attributed to a lack of consistency between the correct recycling practices at the UBCO campus and the broader Kelowna and Canada-wide communities, a lack of bin type consistency and availability, and a lack of adequate and informative signage that was consistent throughout campus. In some cases, the entire recycling bin contents was no longer deemed viable due to food contamination caused by sorting food-contaminated items into the recycling. Through the data collected, it was determined that some solutions to some of these issues included introducing a container washing program for campus-goers to wash out their recycling in order to limit food contamination in the recycling bins, advocating for campus-wide consistency of signage, encouraging more bin availability and the same types of bins being available at each location, and better educating freshman students on waste disposal practices upon entering UBCO.
The need for further research in the future is crucial, as the majority of the student population overturn is every 4 years or so, which could modify the ideas of garbology. By repeating this study in the future, this study could then continue to see a pattern between the years in a four year increment, and the same demographic data of students as the years before with hopefully improved garbology methods based on the findings of this report. There is an importance in encouraging better recycling and composting practices at UBCO in order to restrict the amount of landfill in the world, and the data gathered from our study could provide valuable insight into the realities of sorting and disposal practices at UBCO over a period of time, which can help to create a dialogue around issues of sustainability and how to encourage better and more accurate sorting on campus by determining which aspects of food and waste sorting the UBCO campus community members are the most confused by each year. By routinely conducting such studies, it may normalize and increase the awareness campus goers have of their waste disposal practices.
It is also important to note that this study contained many variables that should be constrained in the future to give a more precise result and an optimized method. If this study is repeated in the future, it will have to take into account that those running the study follow the exact same protocol as this study, so as to not create any unknown bias and variability.
References
Camp, Stacey L
2010 Teaching with Trash: Archaeological Insights on University Waste Management.World Archaeology 42 (3): 430-442.
Consroe, Kimberly., Kurti Marin, Merriman David, Von Lampe Dr. jur Klaus
2016 Spring Breaks and Cigarette Tax Noncompliance: Evidence From a New York City College Sample. Nicotine & Tobacco research 18(8): 1173-1179.
Damron-Martinez, Datha., and Kathrine L. Jackson
2017 Connecting Consumer Behavoir With Marketing Research Through Garbology
Marketing Educational Review 27(3):151-160.
Fahs, Breanne
2015 The Weight of Trash: Teaching Sustainability and Ecofeminism by Asking Undergraduates to Carry Around Their Own Garbage. Radical Teacher 102(102):30-34.
Great Value Colleges
2020 America’s 50 Top Colleges with the Best Recycling Programs. Electronic document, https://www.greatvaluecolleges.net/top. recycling-colleges/, accessed April 6, 2020.
Garnett, T.
2014 Three perspectives on sustainable food security: Efficiency, demand restraint, food system transformation. What role for life cycle assessment? . Journal of Cleaner Production 73(15):10-18
Passafaro, Paola, and Stefano Livi
2017 Comparing determinants of perceived and actual recycling skills: The role of motivational, behavioral and dispositional factors. The Journal of Environmental Education 48(5):347-356.
Queirós, A., Faria, D., & Almeida, F. (2017). Strengths And Limitations Of Qualitative And Quantitative Research Methods. Zenodo. 3(9): 369-383. doi.10.5281/zenodo.887089
Rathje, William L., and Cullen Murphy
1992 Rubbish: the archaeology of garbage. Translated by Anonymous. 1st ed. Harper Collins Publishers, New York.
Rathje, William L.
1974 The Garbage Project: A New way of Looking at Problems of Archaeology. Archaeology 27(4):236-241.
Tu, Qingshi, Chao Zhu, and Drew C. McAvoy
2015 Converting campus waste into renewable energy – A case study for the University of Cincinnati. Waste Management 39:258-265.
Zelenika, Ivana., MoreauTara., and Zhao, Jiaying
2018 Toward Zero Waste Events: Reducing Contamination in Waste Streams with Volunteer Assistance. Waste Management 76,39-45.
Sharing Permissions
|
|
When re-using this resource, please attribute as follows: developed by the University of British Columbia: Garbology of UBCO Project Team.
Page View Statistics
{{#googleanalyticsmetrics: metric=pageviews|page=Garbology_of_UBCO}}
- ↑ RATHJE, WILLIAM L. "The Garbage Project: A NEW WAY OF LOOKING AT THE PROBLEMS OF ARCHAEOLOGY." Archaeology 27, no. 4 (1974): 236-41. Accessed April 6, 2020. www.jstor.org/stable/41685583.
- ↑ Mackintosh, Andrea 2018 UBC Okangan Waste Audit. Green Step Solutions Inc., Kelowna, BC .
- ↑ Great Value Colleges (April 6 2020). "America's 50 Top Colleges with the Best Recycling Programs". Great Value Colleges. Check date values in:
|date=(help)