Documentation:OER Geomatics
Introduction
Background
The UBC Geomatics Textbook project aims to develop an interactive online textbook with open educational resources (OER) for teaching geomatics across UBC faculties.
Existing OER geomatics textbooks are flat: they lack interactive examples, tools, and case studies that make cutting-edge geomatics so engaging. More importantly, Canada is the birthplace of computerized Geographic Information Systems (GIS), yet existing textbooks (both OER and non-OER) adopted in UBC classrooms rarely focus on environmental management issues, case studies, and examples that are relevant to underrepresented northern communities in Canada. UBC excels in teaching geomatics and should have an OER geomatics textbook that reflects the needs of the diverse student body interested in the discipline.
Objective
The goal of the OER Geomatics project is to create interactive visualizations of geographic data and key textbook concepts to enhance the "hands on" experience of students using the open geomatics textbook.
The Winter 2021-2022 term saw the development of two interactive visualizations to support the content of Chapter 2: Mapping Data and Chapter 15: LiDAR Acquisition and Analysis respectively. A third visualization about the electromagnetic spectrum is currently in ongoing development.
Format
The project consists of WebGL visualizations that run in the web browser. The code runs in the client side, so no back-end server is involved. Target platforms include both desktop and mobile devices, with the aim of supporting various ways students might access the textbook. The ability to interact from mobile devices may allow the visualizations to be used as part of in-class activities to enhance active learning.
Primary Features
Each visualization in the project is a separate application whose primary features support the content of a specific chapter in the open geomatics textbook.
Chapter 2: Mapping Data
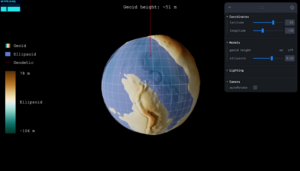
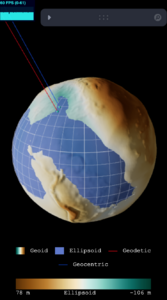
The visualization for this chapter aims to allow students to explore three different models of Earth (sphere, ellipsoid, and EGM2008 geoid) to better understand their differences when referencing height and location on Earth. The current prototype allows users to zoom and rotate around 3D representations of the models.
- Model controls: Users can control the opacity of the models with sliders, allowing more than one model to be overlaid and compared. The flattening of the ellipsoid, a concept described in Chapter 2, can also be set to a value between 0 and 1. Increasing the flattening of the ellipsoid compresses the ellipsoid vertically.
- Latitude and longitude controls: Users can set the longitude and latitude (in degrees) using sliders. The latitude and longitude specify a line, which picks out a particular point on the surface of each model. These intersection points are highlighted on the currently visible models.
- Geodetic and geocentric controls: There are 2 interpretations for the latitude and longitude values: as geodetic or geocentric coordinates. Geocentric coordinates are angles relative to the center of the sphere, while geodetic coordinates are angles relative to the equatorial plane and not necessarily the center. There are separate checkboxes for geodetic and geocentric coordinates, which allows them to be visualized simultaneously for comparison.
- Geoid height view: This view can be accessed by toggling the geoid height view to "on". In this view, only the geoid, ellipsoid, and geodetic latitude are shown. The geoid height at the current latitude and longitude (the difference in height between an ellipsoid and the geoid) is also displayed, rounded to an integer value.
- Mobile responsive layout: To support users who are accessing the visualization on mobile devices, the UI layout is adjusted on narrower screens.


Chapter 15: LiDAR Acquisition and Analysis
- Visualization-specific features
Code
The project code is currently located in a private GitHub repository: https://github.com/ubcemergingmedialab/OERGeomatics. The visualizations are primarily React apps, bootstrapped using create-react-app, and can be built using Yarn (version 1.22.11).
Each visualization is located in its own directory under src . The general folder structure of one visualization is as follows:
src/<visualization>/public: Contains static assets used in the visualization (e.g. 3D models, images).src/<visualization>/src: Contains all the necessary scripts, files, and style sheets for the visualization.
Geodesy visualization (Chapter 2)
This section will provide an overview of the different files and React components in the source code. It is intended to help interested parties understand or modify the code.
The source code is located in the directory src/geodesy/ , as described above.
src/App.js: The App component represents the full visualization. An example of how it is rendered can be found insrc/index.js.src/CoordinateMath.js: This file provides math functions for conversion between important points, in geocentric or geodetic coordinates, and their 3D positions.src/Constants.js: This file contains global constants such as colours and hint text.src/Components/src/Components/styles: This directory contains the stylesheets used in the visualization.ControlsAndLight.js: Contains camera controls that support zooming and rotating, as well as the lighting used in the scene.FreeControlsWithClickDetection: Returns a Three.jsOrbitControlswith some predefined camera settings. This component adds the "Camera" folder to the side menu.SetCameraLayers: When this component is initialized, it makes the layer where the sphere/ellipsoid/geoid models are placed visible to the default camera.CameraAlignedLight: Draws a light that stays at a fixed angle from the default camera as it rotates, making the model surfaces more consistently visible. This component adds the "Lighting" folder to the side menu.
CoordinateLine.js:GeocentricCoordinateLine: Draws a line emanating from the origin whose angle corresponds to the latitude and longitude.GeodeticCoordinateLine: Draws a line that starts at the equatorial plane and is normal to the ellipsoid, whose angle corresponds to the latitude and longitude.MovingLine: An internal component used to draw a 3D line segment.
Geoid.js:Geoid: Draws the 3D model of the EGM2008 geoid (see Art Assets).GeoidModel: An internal component responsible for importing the geoid 3D model. It gives the geoid model a unique object name so that the raycaster can identify it.
GeoidHeightDisplay.js:GeoidHeightDisplay: Displays the geoid height at the current latitude and longitude.GeoidHeightCanvas: Draws an invisible canvas to the screen that contains a lookup table of geoid heights. This lookup table is used by theGeoidHeightDisplaycomponent.
Intersections.js: Contains code that renders the different intersections.SphereIntersection: Draws the intersection of the sphere and the geocentric coordinates.GeocentricEllipsoidIntersection: Draws the intersection of the ellipsoid and the geocentric coordinates.GeodeticEllipsoidIntersection: Draws the intersection of the ellipsoid and the geodetic coordinates.geocentricRaycast, geodeticRaycast: Functions that find the intersection of a given object with the geocentric and geodetic coordinates respectively, using raycasting.- Raycasting is used to find the intersection with the geoid because the geoid surface is irregular.
Legend.js:GradientLegend: Draws the legend for the colour gradient on the geoid.Legend: Draws the legend for the different objects in the visualization.LegendWrapper: A utility component used to position the two legends.LineBlock, ImageBlock, ColorBlock: Draw legend symbols for objects such as lines and solid-coloured models.
Loading.js: Contains a component that renders the loading screen.SpherePoint.js:SpherePoint: A simple component that draws a small point. The point changes color when hovered over. It is used to mark the intersections.
Spheroids.js:Sphere: The sphere model.Ellipsoid: The ellipsoid model.ScaledSphere: An internal component that is used to create the sphere and ellipsoid by deforming a sphere.
Visualization.js: This file contains the main component of the visualizationVisualization: This component draws all the main content of the visualization, including the coordinate lines and the three models. It adds the "Models" and "Coordinates" folders to the side menu.
Art Assets
The visualizations in this project draw from publicly available data.
Geoid 3D model
- A 3D model of the EGM2008 geoid was created to show the geoid undulation at exaggerated scale. The model was created in Blender 2.90.1 and exported as a .glb file (
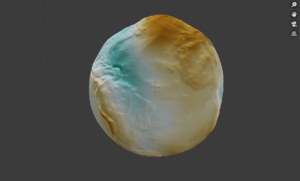
src/geodesy/public/models/Geoid.glb).- The precomputed "egm2008-5" geoid height dataset provided by GeographicLib (source) was used as the basis for the 3D model's displacement map, colour map, and normal map textures. Information about the format and representation of the data files can be found in the GeographicLib version 1.52 documentation.
- A diverging colour scheme was selected for the false colour shading. Shades of blue represent heights below the reference ellipsoid, while shades of brown represent heights above the reference ellipsoid; this colour scale was chosen to suggest being "above" or "below" sea level to strengthen the association for users.

Geoid height lookup table
- A PNG file representing a grid of geoid heights was created to support looking up the approximate geoid height at a specific latitude and longitude.
- Geoid heights were obtained from the Geoid Height Calculator provided by UNAVCO, using the egm2008-5 geoid model and cubic interpolation.
- A csv file containing a grid of latitude and longitude coordinates was uploaded to the calculator. The geoid heights outputted by the calculator were saved and written into a PNG image using the following R script:
library(readr)
library(raster)
library(png)

geoid_heights <- read_csv("path/to/geoid/height/file.csv")

points <- geoid_heights[, c("Longitude", "Latitude", "Geoid Height (m)")]
colnames(points) <- c("x", "y", "z")

r <- rasterFromXYZ(points)

height_matrix <- as.matrix(r)
upper <- max(height_matrix)
lower <- min(height_matrix)

height_matrix_transformed <- (height_matrix - lower) / (upper - lower)

writePNG(height_matrix_transformed, "geoid-height-grid.png")
Libraries
Third party packages used for this project include:
- three.js, a JavaScript 3D library
- react-three-fiber
- Used to build three.js applications using React syntax
- leva
- Used to create a menu panel for controlling variables in the visualization
First Time Setup Guide
The following instructions describe how to obtain and run a local copy of the OER Geomatics visualizations – for example, for development or experimentation.
- This project requires Node version 14 or higher. Node can be installed here: https://nodejs.org/en/
- To verify that Node is installed properly, open a terminal and type the following command:
node --version
- Once Node is installed, clone the repository from the EML Github (it is currently private): https://github.com/ubcemergingmedialab/OERGeomatics
- Open a terminal in the folder where you cloned the project. The code for each visualization is located a sub-directory of
src, so in order to run a particular visualization, first navigate in the terminal to the folder containing that visualization. For instance, to run the geodesy visualization, type
cd src/geodesy/
- Once in the directory, first install the required dependencies by typing the command:
yarn install
- From now on, to open the visualization in the development mode, use the command
yarn start
- As long as the server is running, the visualization can be accessed at http://localhost:3000.
Development Team
Principal Investigator(s)
- Dr. Paul Pickell, Assistant Professor of Teaching, Geomatics
- Evan Thornberry, Geographic Information Systems (GIS) Librarian
Student Team
- Juno Yoon, Project Lead/Developer (Sept 2021 – Present)
- Floria Gu, Developer (Sept 2021 – Present)
- Kenny Zhou, Volunteer (Sept 2021 – Present)
Staff Developer
- Dante Cerron, Developer (Sept 2021 – March 2022)
License
Last edit: May 6, 2019 by Jin Li
|
|
