Documentation:Metabolism
| Emerging Media Lab | |
|---|---|

| |
| About EML | |
| A collaborative space for UBC faculty, students and staff for exploration of emerging technologies and development of innovative tools and solutions. This wiki is for public-facing documentation for our projects and procedures. | |
| Subpages | |
Introduction
Background
Metabolism is a term used to describe a complex network of different chemical reactions that are essential to sustaining living cells. The metabolic network in multicellular organisms is reputed to be difficult to learn due to the intrinsic complexities and interconnectedness of pathways and their intermediates. Understanding these metabolic pathways and the reactions they are comprised of are essential to learning about biological processes for students in related sciences, such as biochemistry and cell biology. These and similar courses currently focus on the memorization of pathways and disease states caused by pathway abnormalities. By representing reactions of pathways and intermediate metabolites as lines and dots, respectively, a 3D model of the network can be generated to provide enhanced interactivity and learning engagement.
Objective
The 3D Metabolism project aims to provide an interactive, immersive, and visually appealing educational tool for students to complement their studies of metabolism. It is hoped that by providing an integrated resource combining 3D illustrations of eukaryotic cells and animating key metabolic pathways, students can further grasp metabolic concepts learned in the classroom. The development of this resource will provide the user with the ability to navigate between the overview of the metabolic network and a focus on individual pathways. This resource design will help enable engagement and make the relevance of each pathway more apparent. The ongoing project further aims to help students predict physiological outcomes and understand disease states through the user manipulation of pathways.
Format
This project will focus on a WebGL application accessible on the desktop versions of Firefox and Chrome as the primary delivery to maximize ease of use and accessibility. This project stores its biochemistry data on WikiBase, available at the following website: http://wikibase-3dm.eml.ubc.ca:8181/wiki/Main_Page
Primary Features

This feature enables the user to navigate the metabolic network by clicking the metabolites of the network move along the network while dragging will rotate the model.
Zoom Functionality
The "Zoom In" feature enables the user to view connections within the network more closely. The user can always control the zoom level by scrolling in the network area, while highlighting a pathway automatically adjusts the zoom to contain the aggregate of all highlighted paths.
Pathway Highlighting
The user is able to select any number of the existing pathways to be highlighted using the buttons listed in the "Pathways" menu tab. There are two levels of highlighting, where the second level is limited to one pathway at a time.

Information Side Cards
By clicking on a metabolite, reaction, or pathway button, the user will pull up a side card with biochemistry information regarding the clicked object. This is populated with data queried from the 3D Metabolism WikiBase.
Secondary Features/ UI Additions

Labeling System
One issue that was brought up during the user testing surveys was the visibility labels of all the nodes and edges. The labels were large and overlapped one another making comprehension very difficult. We tackled this problem by redesigning the labeling system entirely, following an approach similar to the ‘google maps’ label system.
The default zoomed out view of the network only displays the pathway labels, once you start to zoom into certain areas of the network the node and edge labels will begin to appear. Depending on which angle we are viewing the network, only the labels at the front and center of the camera will be in focus while the other labels will be slightly translucent and less in focus. We can view these other node and edge labels by changing our camera angle to focus on the other node and edges instead. These new labels are also smaller in size and have a small black outline around them to make visibility overall better.
Settings Tab

.png)
We created a settings tab for users to be able to customize their view of the network labels. They will have the option to view either all, highlighted or accented labels for the nodes, edge and pathways. There is also a slider to change the text size of each node and edge labels separately. Cofactor visualization can also be enabled from this settings tab. The user will have the option to view all, highlight or accented cofactors and ever filter them according to cofactor type. Camera lock and reaction arrow view can also be enabled and disabled through this settings tab.
Spotlight Feature
In order to save time and make navigating through the network easier, the spotlight feature was developed. When you hover over a node or edge, that object gets highlighted along with its label. The label gets bigger and brighter to highlight that particular object. This spotlight feature aids in navigation through the network as the user can hover over nodes and edges to find the one they are looking for instead of having to click on all of them opening a side card to identify the object.
Search Bar
The search bar feature allows the user to easily navigate through the network and locate any node, edge, or pathway. The user can type in their desired metabolite, reaction or pathway and once clicked from the search bar recommendations, the camera moves towards that respective node, edge or pathway, highlighting it.
Compound Visualizer
When each node is clicked a side card opens up containing scientific information about that metabolite. A compound visualizer was added to this side card where the user can view and interact with the 3D molecular structure of that metabolite to further aid in educational and research purposes. With this compound visualizer, the colors of the molecules were changed to fit the standard scientific colors in order to make it more accurate. We also made interacting with this 3D structure more fluid and easy to navigate for the user, allowing them to move the compound and view it from all angles.
Camera Movement
Earlier iterations of 3DM had a much more static and rigid camera movement, where it could move only up or down and around the network. This was changed to a much more fluid camera movement system with the option of switching on camera lock if the user does not want the camera angle to change when they click on different pathways. Not only is the user able to more freely navigate through the network, but another feature was also added where once a pathway is clicked, the camera moves to provide the user with the best view of the clicked pathway.
Edge Arrow Sleeves
We wanted to incorporate arrows in the network in order to show bidirectionality of the pathway reactions. We initially added the arrow as part of the network model by adding a cone towards the end of the edges. While this worked initially, due to different sizes of edges, the arrow cones scaled differently at every edge making the arrow almost illegible.
Our challenge was to figure out how we can incorporate arrows to the network in a legible manner without overcrowding the existing labels. We decided against adding the arrows to a 2D label since the node, edge and pathway labels were busy enough. Our solution was to create thin sleeves that go on the edges where the arrow is digitally painted on Blender. This edge arrow sleeve will only be 1 unit larger than the size of the edge making the sleeve look virtually invisible on the model, only the arrow will be visible. The sleeve will move around the edge following the camera movement to allow the user to view the arrow from all angles. These arrows can be enabled by double highlighting the pathway allowing us to see the direction of the reaction.
Cofactor Visualization
Cofactors are helper molecules that initiate and terminate reactions and enzyme functionality. They are essentially mini reactions that occur at each edge. We wanted to demonstrate how these different reactions come about and where the energy comes and goes from, making it a useful study tool. We made multiple versions of the cofactors, some of it being displayed on the side cards, some being displayed on the network as a label or even a 2D object. After multiple iterations and discussions, we settled on having the cofactors be displayed as a 2D object on the network which can be enabled and disabled from the settings tab. We tested out different scaling, color codes and shapes of the cofactor labels to ensure it did not interfere with all the other labeling, had good visibility and was comprehensible both on a pathway level as well as a network level.

We settled on a rounded rectangle label with black text for the cofactors and a white arrow indicating their direction. The cofactors were color coded in pairs of sub-reactants and products and were able to be filtered according to cofactor type from the settings tab. When it came to implementing these cofactors, pinpoints were placed on the Blender model to indicate where we wanted the cofactors to be placed. These pinpoints were labeled according to which side of the edge they were placed on (left, right, up or down). They were then implemented on Unity after the new Blender model was imported.
Animations
Animating key metabolic pathways for students to better grasp these concepts was an objective that was present at the start of this project. Previous terms had some node to node animations implemented using the Interactive Animation Toolkit For Unity (IAT4U). This term, we wanted to tackle implementing pathway, cofactor and Oxphos animations.
Reaction Animations
Initially, our plan was to make animations using keyframes on the Unity animation editor and make them playable by clicking a play animation button from the side card. However, we ran into bugs when this was implemented as the Unity animator would override all the other scripts affecting the highlight functionality of all the animated pathways. We tackled this problem by scripting the animation functionality repurposing some of the earlier node to node search animation scripts to create our own pathway animations. A limitation to this approach is that we will not have detailed smooth animations that we were able to make using keyframes and animation curves since scripting animations is a much different process. However, going down this animation scripting path, allowed us to implement both pathway reaction animations for every pathway and also revamp the existing node to node search animations.
Cofactor Animations
Using the same method of animation scripting, cofactor animations were also implemented. These animations showed the appropriate cofactors at each edge go in and out of the edge to display the mini reaction that is occurring. These cofactor animations are played when the reaction or node to node animations are being played. While the reaction animations display the flow of the reaction by highlighting the nodes and edges down a pathway, the cofactors are seen entering and exiting at every edge where there are cofactors.
Network Model

The network model was created on Blender, an open source 3D modelling software and then imported into Unity. In the initial stages of this project the nodes and edges on the network model in Unity were misaligned creating small gaps in the network. After some inquiry, it was found that this alignment issue stemmed from the Blender model. To fix this issue, we went into the existing Blender file and edited the network to have more a seamless connection and create a more polished product. We also made changes to the curved edges to have straight more geometric lines to allow for a more practical implementation of the bidirectional arrow sleeves on the edges.
Additionally, the oxidative phosphorylation complexes were also changed from the existing cubes to more scientifically accurate transporter models.
Methods
Note: This section is currently outdated, we are working on getting it caught up!
Platform
This project runs on the cross-platform game engine Unity. This framework allows us to create 3D scenes quickly and expressively, with extensive documentation and resources provided online by Unity and other users to allow team members to learn easily.
Design

Overview
The information that this visualization will represent can potentially be very complex, so our design makes sure to structure that complexity in order to avoid a situation where the scope of the content grows beyond our ability to make the system extendable. In the image to the left there is a separation between entities that exist in the code and entities that are generated at runtime, our Presenter being the transition point.
Runtime Objects
These objects are created by the Presenter using information from the View. Currently, these entities are not represented as classes in the source code, they are simply created in javascript and appended to the DOM using this method by the Presenter component.The arrow relationships in the Runtime Instantiation section of the entity diagram represent parent-child relationships between DOM elements. A-Frame leverages these relationships as coordinate frames. That is to say, if SceneElement rotates, then ReactionElement rotates too, using SceneElement's position as its pivot point.
Presenter
The javascript file presenter.js declares an A-Frame component with some app state information (right now, only activePathway). It also contains some helper functions where, using the method mentioned above, Presenter generates DOM elements with components configured to represent the information contained in the View
View
The javascript file viewer.js declares a module that contains all of the information that will be used by Presenter to generate the network. According to this design, presenter should not need any additional information except runtime state and user interaction to create the scene and make it interactable. Nodes is a Dictionary from string to Node class, where the string will represent a metabolites "code" name. This is necessary because many metabolites have names that can't be used as variable names. Pathways is a dictionary from string to Edge class, this string is the "code" name for a pathway, which is needed in order to implement logic based on what pathway is currently active. An edge is defined as an input string and an output string, as well as a collection of information for the reaction visualization and some helper functions to be used by Presenter. The input and output string here are intended to refer to the "code" names of the metabolites in the Nodes dictionary. Sequences is a list of Sequence class. Currently in the code the sequences are just declared using JSON, there is no class notation for Sequence yet. The pathway string is used to define which pathway this sequence is related to (sequences will behave differently based on active pathway). The list of string is intended to refer to the "code" names of metabolites, as a sequence is a series of reactions that happen in a pathway, so the sequence of metabolites involved in the sequence is necessary to create the corresponding animation.
Notes
- The "code" names used in several places in the design are not necessarily intuitive. Here are some rules for creating more "code" names.
- If the metabolite name starts with a number, add an underscore "_" to the beginning, and javascript variable names cannot start with numbers.
- All other spacing characters (spaces, commas, hyphens) are not allowed in javascript variable names, so replace them with underscores too.
- Example: 1,3-bisphosphoglycerate becomes _1_3_bisphosphoglycerate
- Currently, an id naming system is used to be able to refer to metabolite nodes and reaction edges after they have been instantiated. That naming convention is as follows:
- For metabolite nodes: The id is the same as their "code" names, aka, their string key in the Nodes dictionary.
- For reaction edges: The id is the same as edge's input string and output string put together, with a foward-slash in between. For example: _1_3_bisphosphoglycerate/_3_phosphoglycerate
Discussion
User-testing Results
In April 2023, we opened a user-testing survey for second-year biochemistry students. The survey was comprised of questions that would make students navigate the build and use its features. Students were then given the chance to provide feedback on the strengths of the website and areas that needed improvement. 16 out of 19 participants noted that 3D metabolism made finding important information fast and visualizing metabolic pathways easier. When asked what should be worked on, 16 participants said that the labeling system was overwhelming, messy, or overlapped too much. Another aspect that was recommended to improve was the navigation controls. Students found it was not intuitive and suggested a tutorial or help tab. In the survey, we had a question that required students to find the number of carbons in a certain molecule. We noticed that students who used the compound visualizer to find their answer were always incorrect. We realized that the compound visualizer needed to be easier to analyze. After user-testing, most of the goals for the 2023 summer term were to improve these faults.
Challenges
Challenges to be documented:
- The struggle to get rotation to work right for the zoom-in feature
- Positioning of elements relative to camera and drag-rotate's z-axis problem
- Visual elements to represent pathway sequences (animation)
- Finding the right method to create web-vr friendly models (gltf importer)
Code
- The Unity version for this project is 2020.3.7f1
- The repository for this project can be found at https://github.com/ubcemergingmedialab/3DMetabolism
- The file structure is organized like this:
- /
- /UnityProject2018
- /Assets - files that are used in the build
- /Animations - files used to animate the network
- /Editor - files for custom editor menus
- /Materials - materials applied to GameObjects to give color, texture, etc.
- /Menubuttons - image files for the project UI
- /Models - 3D models of the network made in Blender
- /Prefabs - Unity files that allow multiple objects of the same type to be updated concurrently
- /Resources - ScriptableObjects and the query results are stored here
- /Scenes - scenes are the 3D space generated by Unity
- /Scripts - all scripts used in the project
- /Packages - add-on packages for the build
- /ProjectSettings - project configuration
- /UIElementSchema - base UI for generating ScriptableObjects
- /UserSettings - user-specific settings for the editor
- /Assets - files that are used in the build
- LICENSE
- README.md
- /UnityProject2018
- /
Art Assets
The art assets developed for this project are also part of a UBC Studios production on the same subject matter. They include:

Molecule models
- These models are used for the lower-level visualizations of the reactions happening within each edge.
- In the project they are used in .glb format, exported from .obj using Blender 2.8
(Pending documentation on workflow to create these models)

Organelle models
- These models are used for the network-level visualization, to demarcate the barrier between reactions happening inside or outside an organelle.
- These models are also in .glb format, exported from .obj using Blender 2.8
(Pending documentation on workflow to create these models)
Future Direction
- Oxidative Phosphorylation Animations
- Introductory Tutorial or Help Tab for first time users
- Mousepad and Tablet Compatibility
- Amino Acid Degradation
- Add More Pathways and Transporter to the Network
- Account Creation to Save Custom Pathways
- 3D Metabolism Website Design
Libraries
3rd party code assets used for this project include:
- SkyboxPlus
- Used to create the skybox/background for the project.
First Time Setup Guide
- This project runs on Unity.
- First, download and install Unity Hub from: https://unity3d.com/get-unity/download
- After installing Unity Hub, download Unity 2020.3.7f1 from: https://unity3d.com/get-unity/download/archive
- Once Unity 2020.3.7f1 is installed, clone the project from the EML GitHub: https://github.com/ubcemergingmedialab/3DMetabolism-Unity
- Before editing the project, ensure you are connected to a UBC internet connection or are using UBC myVPN in order for the project to be able to query the WikiBase.
Poster
Upload a pdf link of your poster to the wiki. An editable version of the document is preferred.
Development Team
Principal Investigator(s)
- Lindsay Rogers, PhD, Biochemistry and Molecular Biology Lecturer
Student Team
- Reva Nambiar, Project Lead/ UI/UX Designer (May 2022 - Aug 2023)
- Mohsen Movahedi, Developer (September 2021 - Present)
- Kenneth Ofori-Amanfo, Subject Matter Expert (May 2023 - Aug 2023)
Student Volunteers
- Farida Kayed, Subject Matter Expert (Jan 2023 - Jul 2023)
- Joshua Yoon, Developer/Subject Area Expert (May 2021 – May 2022)
- Daisy Ye, Website Designer/Subject Area Expert (May 2022 - Aug 2022)
- Mahak Arora, Designer/Subject Area Expert (May 2022 - Dec 2022)
Staff Developer
- Frederik Kjaer Svendsen, Staff Developer (April 2023 - Present)
- Robert Shum, Staff Developer (September 2022 - March 2023)
Staff Designer
- Kim Nipp, 3D Artist, UI Design (May 2020 - May 2023)
Past Team Members
- Rayyan Saiyed, Project Lead, Developer/Subject Area Expert (September 2021 - May 2023)
- Michael O'Keefe, Developer (May 2022 - Dec 2022)
- Tom Mo, Developer (September 2022 - Dec 2022)
- Ella Grey, UI Designer/Subject Area Expert(January 2022 - May 2023)
- Jazica Chan, Developer (May 2020 – Aug 2020)
- Nikko Angelo Dumrique, Developer (May 2020 – August 2021)
- Hai Lin Zhang, Developer (September 2020 - April 2021)
- Courtenay (September 2020 - April 2021)
- Rosaline Baek, UI Designer (September 2021 - December 2021)
- Joshua Spiegel-Brown, UI Designer/Subject Area Expert (September 2021 - May 2022)
- Dante Cerron, Staff Developer (May 2020 – March 2022)
- Jenn Gechen, UX/UI Design
- Jeffrey Chow, Volunteer
Special Thanks to: Catherine Winters, Daniel Lindenberger, Scott Covey
Engineering Notes
WebGL Builds in Unity
File Systems in WebGL:
What we learned is that accessing local file systems from a web build will not work. This is most likely for security reasons, and we will most likely get a error in the console that claims "File or Directory not found". To get around this issue, there are a few options but not limited to:
- For text files, as an example: bind the file to the inspector, and in the code, create a public variable of type TextAsset (https://docs.unity3d.com/Manual/class-TextAsset.html). We could then manipulate the text object without using the FileSystem.
- Use UnityWebRequest (https://docs.unity3d.com/Manual/UnityWebRequest-RetrievingTextBinaryData.html) to fetch the file. The downside is that the file must be hosted somewhere on a webservice, however, it allows for a more robust solution as there is separation between the file and the build.
Testing and Deploying in WebGL to AWS S3:
see the ReadMe in develop branch: https://github.com/ubcemergingmedialab/3DMetabolism-Unity/blob/develop/README.md
Sidecard Layout Hierarchy
Before, elements were hardcoded to specific Y coordinates, which makes re-arranging elements very difficult.
Now, we use a system using Unity Layout components and a scrollbar to manage content. See below.

Notice the Scrollable Content GameObject has layout group and content size fitter components to automatically fit and space out elements. For elements that are underneath Scrollable content that are not part of the layout group we would use a Layout Element component to ignore the layout. An element that would use this would be the CompoundControllerCamera for example (because we don't want to move the camera based on the layout).
The <Tab Break> GameObjects have Layout Elements with minimum height and they act as 'heading spacers' between categories. If we didn't do this we would have evenly distributed spacing between every single component, and we don't want that.
Updating Query.xml
Currently, starting the app does not pull the latest data from Wikibase and generate a new Query.xml, so this must be manually generated. Fortunately, there is a GUI that allows us to do this.
In Unity go to Window -> Query Service -> run query (leave options default).
This will generate a brand new Query.xml and will automatically get referenced when 3DM starts.
QueryService.cs
For high level architecture go here: https://miro.com/app/board/uXjVPTuMDOs=/?moveToWidget=3458764545917135281&cot=14
A drawback in the current implementation is that when we initialize the data for edges and nodes, the key value we are using is the label of the metabolite itself. Example: ornithine (mitochondrion), or ornithine (cytosol). This means if that we wanted duplicated labels, this would not be possible as the logic will skip over duplicates, and those duplicates won't get initialized. One way to fix this is to use the QIDs instead for the key value pair. A reason why we want to move away from labels as a key is because our PI suggested that our labels are getting too long and is taking up too much screen space. The PI also noted that some of the text inside the brackets like (cytosol / mitochondrion) are not very useful for the user so it could be hidden or removed. Another way to solve this problem is to use regular expression and hide/show the text inside brackets with a toggle in the settings tab somewhere.
Game Object Tags
Edge / Node templates in Unity will have hard-coded tags that represent the unique label for a given edge or metabolite. These tags will be looked up, for example, in GameObject.FindGameObjectsWithTag in StatusController.cs and HighlightPathway.cs (in order to do their tasks such as highlighting a pathway).
These tags shouldn't have to be manually set as they are done in SetEdgeTagOnStart.cs for example. However, if we wanted to add new metabolites / edges / or expand our network, we would have to add the tags manually in order for this to work. This isn't ideal as tags are supposed to be used to classify different types of objects, like "players", "npcs", or "UI" for example and not specific unique elements.
Special Characters Showing in Play/Edit Mode (But not in WebGL / AWS)
This is a recurring bug that still exists in many places in 3DM. This is due to the fact that normal Text components are not converting special characters when the project is published to WebGL. One way to fix this is to use TextMeshPro in place of Text components. Here are the general steps to fix this:
- Replace the problematic Text component with TextMeshPro, make sure this doesn't cause any regressions and that the code is referencing the newer component over the basic Text one.
- Go to TextMeshPro -> Font Asset Creator.
- Select a Source Font File (your choice)
- Select a Font Asset (select one from assets->font folder to load the custom character list from that asset).
- Add the special characters you want to render correctly (in this example, it's the Greek B character).
- Select Generate Font Alias
- If it works, you should see 0 missing / excluded characters (this means we were able to create a new asset with the special characters). Note: if it doesn't work, it means we cannot use this font file to generate the special character, so you need to try a different one.
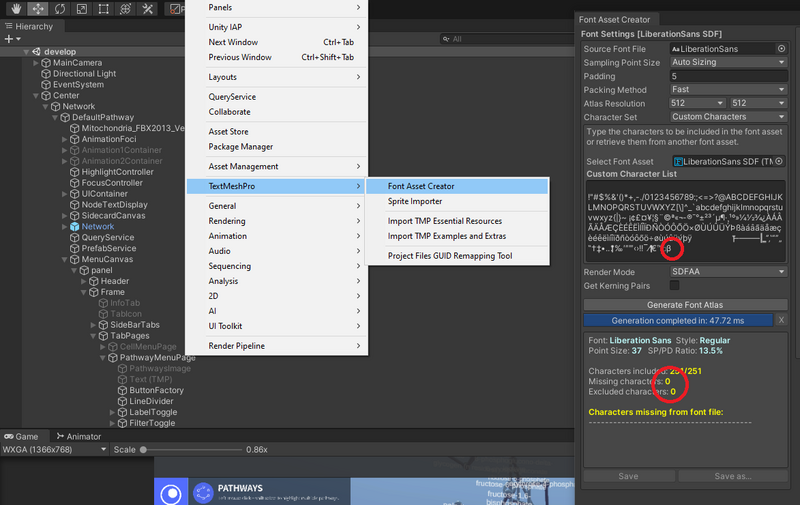
- Save As a new font asset (I placed all the ones we use in Assets->Fonts).
- in the component with the new TextMeshPro, reference the new font asset that you just created.
- Test this in Edit/play mode.
- Test this in WebGL mode.

FAQ
As the title suggests
Bibliography
Provide enough information for a first time user to get up and running.
License
Last edit: May 6, 2019 by Jin Li