Course:Phys341 2020/Brainwaves and silence

Silence is the perceived absence of sound. The context of the listening experience plays a large role in how silence is perceived.[1] In a musical context, silence may activate the brain in a similar way as non-silence material, suggesting that the memory of what has just been heard and/or the anticipation of what is to come plays an important role in cognitive processing and musical perception.
Background
Human perception has been a fascination of philosophers and scientists since at least the time of Aristotle, but it is only since the advent of psychophysics that measurements of subjective experiences have been possible.[1] In the mid 19th century Gustav Theodor Fechner, driven by a desire to express mathematically the prevailing cartesian mind-body dualism model of self, made a foundational discovery. He noted that if he ignored the philosophical quandaries of subjectivity, and focused simply on the response of the subject and quality of the mechanisms for obtaining that response, he could determine units of measurement and scales within subjective experience. He projected that if one were to monitor the smallest possible noticeable change in some value, then that should yield the smallest unit of that scale. This led to Weber's Law, which though imperfect, laid the groundwork for further explorations and refinements in the measurement of perception.[1]
Threshold of hearing

Silence does not mean that there are no vibrations of the air particles. In fact, even in an anechoic chamber there will be random thermal motion as well as the sound of the perceiver's blood coursing through their body. Silence denotes that whatever vibrations are present either lie outside the frequency range of human perception (20Hz-20kHz) or do not meet the threshold of intensity that qualifies as sound. This threshold varies from person to person, but attempts have been made to find an average. In laboratory settings, with a pure tone of 1000Hz, it has been found that this threshold is generally about 20 micropascals or 20dB in young people with healthy hearing apparatus. In different contexts, this threshold can change significantly.
Hysteresis Effect
The Hysteresis effect means that humans will more easily perceive a stimulus as it is being removed than when it is being introduced. For instance with the threshold of sound, when a pure tone is already present and is being lowered to where it cannot be heard, the reported threshold will be lower than if the tone starts in silence and gradually increases the volume. This is due to the anticipation involved in hearing a sound decay and expecting to hear it, versus the increase from silence having to compete with the ambient noise floor to be recognized.
Auditory Masking
Auditory masking is the effect of two simultaneous sounds where one obstructs the audibility of the other. The obstructed sound is considered masked while the obstructing sound is masking. The amount of masking is infinitely varied depending on the type of sound for each (ex. pure tone, noise, speech, etc) as well as their relationship to each other.
Auditory Fatigue
Auditory fatigue entails the effect of silence on the listening apparatus. If a listener has been exposed to an amount of noise for some time, and the noise is turned off, their hearing sensitivity will be lowered, and increase gradually the more silent rest they have. This effect is intensified with the duration and loudness of the noise.
Electroencephalography
Electroencephalography(EEG) is a method of placing electrodes on the skin to detect electrical activity emitted from the brain. This electrical activity oscillates at certain frequencies that have been grouped into five main bands. Delta waves are the slowest, oscillating between 0.5-0.4Hz. They are associated with deep dreamless sleep. The second slowest are theta waves, operating between 4-8Hz. They have been associated with deep states of meditation, dreams, and creativity. Next there are alpha waves, which are the easiest to monitor and were the first to be discovered. They oscillate between 8-13Hz and are associated with wakeful relaxation and light meditation. Beta waves oscillate between 13-32Hz and are associated with activities requiring active attention like conversation. Gamma waves are the most recent discovery and the least understood. They oscillate between 32-100Hz and have been noted to operate in very short bursts which move extremely quickly throughout the brain. A popular hypothesis is that they are associated with realizations, creativity, and learning. It must be noted that at any given time all these waves are present to some extent, it is simply that during certain states, some frequencies tend to have more power than others. [2]
EEG and Music
Music is an extensively varied and complex experience, and depends on many factors including the type of music, whether the subject is listening or playing, as well as the cultural and musical background of the subject. For instance, it has been found that areas of the brain associated with spatial and auditory processing as well as motor skills were greatly expanded in professional musicians versus non-musicians.[3] Listening to music is also known to stimulate several areas of the brain bilaterally, including areas linked to memory, language, emotion, and creativity. As such it is difficult to make conclusive statements about the effects of music on the brain. Attempts have been made, such as a study in the Journal of Brain Research which showed that a group of musically untrained individuals raised in China listening to Guqin music showed an increased level of mean phase coherence in the alpha band as well as increased communication between small-world network organizations when compared with listening to silence or noise.[4]
EEG and Musical Silence

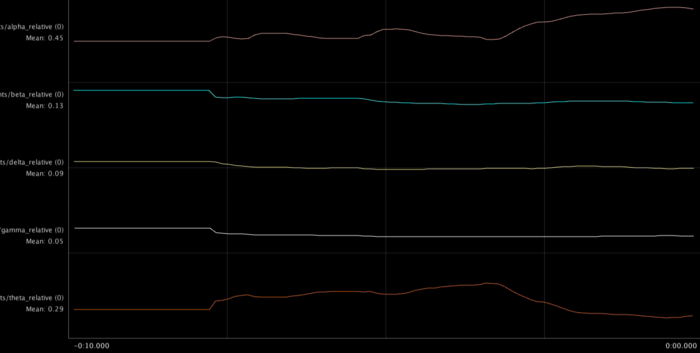
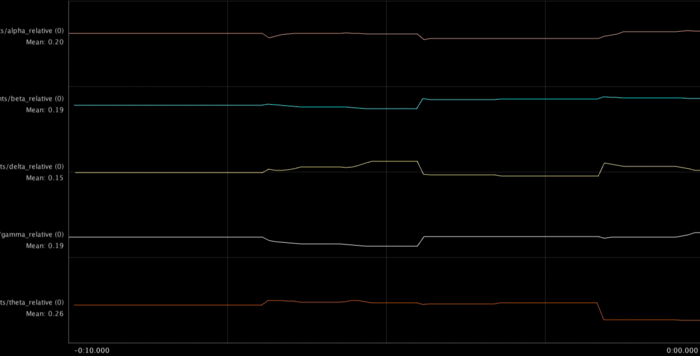
As we can see, the link between EEG data and music listening and silence has been analyzed, but a lesser studied area is that of musical silence. In some forms of music, silence can play an important role. In the tradition of occidental notated music, a rest (or tacet) is used to communicate to the player to not play (Fig.1). This phenomenon poses the question of whether silence in a musical context plays the same role as silence in a non musical context. Using the MUSE headband by InteraXon, we can record and analyze EEG data. This device uses four channels which can be decoded into the five frequency bands emitted from the brain. Though four channels is limited compared to more expensive equipment, the MUSE headband has been to found to be the first consumer device capable of providing results sufficiently detailed and accurate for research.[5] The following data shows the brain in three states. In figure 2 the brain is at rest. Note the relatively low mean power of the beta channels as well as the relatively high mean power of the alpha channel.

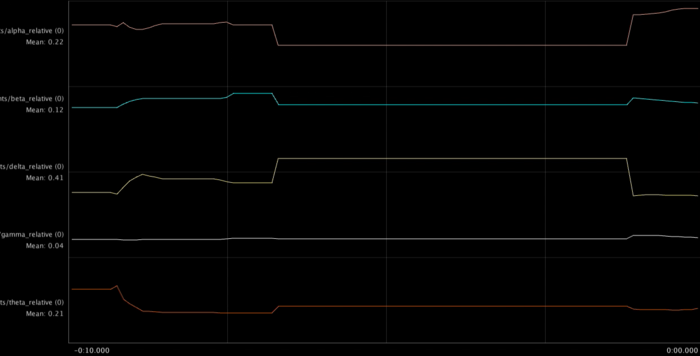
Figure 3 depicts the brain during active conversation. Note the increase in mean power of the beta channel, and the suppression of the mean power of the alpha channel.

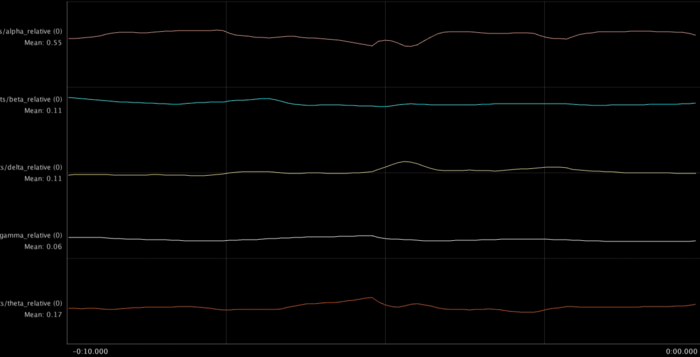
The next three examples display the brain in three different states, respectively, before the sound event (Fig.4), at the moment of the sound event (Fig.5), and ten seconds after the sound has subsided (Fig.6). These measurements were taken while listening to the piece Coronaby Toru Takemitsuwhich features prominent silences. Note that at the moment of the sound event, the mean alpha power is increased almost double, perhaps as a reactive shock to the sudden sound, and then within 10 seconds, the mean alpha power has lowered, but not to its original level. This suggests that the memory of the sound may still be affecting the EEG readings. Conversely, the mean delta power decreases significantly at the sound event, and stays low after. This suggests that the shock of the event decreased the relaxation of the subject, which remained in memory after the sound event subsided.


Conclusion
One interpretation of the data above is that musical silence is interpreted by the brain not like musical sound, or non-musical silence, but something in between. The way that the mean power of the alpha channel quickly rises upon a sound event, but then lowers somewhat, implies that that brain is shocked by the sudden sound, and is then able to gradually rest, but not fully. The mean alpha power remains elevated—whether from the memory of the previous sound or the anticipation of what is to come, we cannot be sure without further study. More work will need to be done in the research of musical silence if we hope to make conclusive statements. There are several limitations to the mini-study preceding. Firstly, it used a sample size of one. Secondly, the MUSE headband, though far more advanced than any EEG technology previously available to the consumer market, operates with only four channels, in comparison with as many as 256 channels in more expensive machines. This can allow for more sophisticated processing of data, particularly spatialization. Lastly, there are several limitations with EEG itself. Even with a 256 channel EEG, much interpretation is needed, which is then subject to human error, whereas fMRI can directly locate the areas in the brain that are active.
See also
References
- ↑ 1.0 1.1 1.2 Hirsh, Ira J. (1954). The Measurement of Hearing. New York: McGraw-Hill.
- ↑ "A Deep Dive into Brainwaves: Brainwave Frequencies Explained". Choose Muse. June 25, 2018. Retrieved March 29, 2020.
- ↑ Gaser, Christian (2003). "Brain Structures Differ between Musicians and Non-Musicians". The Journal of Neuroscience. 23.
- ↑ Wu, Junjie (September 14, 2012). "Graph theoretical analysis of EEG functional connectivity during music perception". The Journal of Brain Research. 1483 – via Elsevier Science Direct. line feed character in
|title=at position 58 (help) - ↑ Krigolson, Olave E. (March 2017). "Choosing MUSE: Validation of a Low-Cost, Portable EEG System for ERP Research". Frontiers in neuroscience. 11 – via NCBI.