Course:KIN570/TOPICS/Significance Testing/Power & Effect Size
| Research Methods | |
|---|---|
 | |
| KIN 570 | |
| Section: | 001 |
| Instructor: | Dr Nicola Hodges |
| Justin Ting | |
| Email: | |
| Office: | |
| Office Hours: | |
| Class Schedule: | |
| Classroom: | |
| Important Course Pages | |
| Syllabus | |
| Lecture Notes | |
| Assignments | |
| Course Discussion | |
Sample Size
To adequately test a hypothesis, determining the minimal sample size is an important consideration. There are four factors which determine the minimal sample size:
1. Effect size
2. Significance level (α)
3. Statistical power (1-β)
4. Statistical analysis procedure
Effect Size
There are multiple definitions of effect size and Kotrlik and Williams have summarized many of them [1]. Conceptually, effect size is a number which estimates the magnitude of a relationship between an independent variable and a dependent variable. Effect size can be thought of as:
1. a standardized difference between means (Cohen’s d)
2. a correlation between independent and dependent variables (e.g. Pearson’s r)
3. the amount of variance in a dependent variable explained by an independent variable (e.g. R squared, ω squared).
Effect size may help in determining the practical significance (i.e. importance) of a result. For example, a statistically significant result with a very small effect size may not have practical significance. Large effect sizes typically indicate a practical significant relationship between two variables. A large effect size found in an experimental setting would likely represent a true relationship in a real-world setting. However, practical significance is not limited to large effect sizes. The field of study must be taken into account when interpreting effect size since there may be multiple interpretations for a given effect size.
Previous publications may be used to estimate an effect size. If there is no known effect size, a pilot study can be conducted to calculate one. It is important to be familiar with and to ensure the measurement tool or instrument is able to detect the estimated effect size [2] . In sample size analysis, smaller effect sizes would necessitate a larger sample size.
Types of Error
There are two types of error in hypothesis testing: type 1 and type 2 errors.
Type 1 Error
A type 1 error occurs if null hypothesis is rejected when it is actually true (i.e. stating that a difference exists when in reality there is no difference; also known as a false positive). The Greek letter α is the probability for making a type 1 error.
Type 2 Error
A type 2 error occurs if the null hypothesis is not rejected when it is actually false (i.e. stating that there is no difference when in reality there is a difference; also known as a false negative).
The Greek letter β is the probability for making a type 2 error.
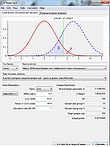
α and β are inversely related, although they do not sum up to 1. Their relationship is graphically represented below.

Table 1. Possible outcomes of null hypothesis testing. Ho = null hypothesis, α = the probability for making a type 1 error, β = the probability for making a type 2 error.
| Experimenter decision: Do not reject Ho (no difference) |
Experimenter decision: Reject Ho (difference) | |
| Ho True (no difference) | Correct Decision | Type 1 Error (α) |
| Ho False (difference) | Type 2 Error (β) | Correct Decision |
Significance level (α level)
The significance level is determined by arbitrarily choosing an acceptable α level. Typically, α is set at 0.05 which means there is a 5% probability of making a type 1 error. In sample size analysis, setting a smaller α level would necessitate a larger sample size.
Power (1-β)
Power is the probability of not making a type 2 error. Power is the probability of rejecting the null hypothesis when it is false (the correct decision). Power is calculated by subtracting β from 1. Conventionally, an adequate level of power can range from 0.7 to 0.85 (thus, β would be 0.3 to 0.15). Like α, the power level is chosen arbitrarily. When evaluating a result which is not statistically significant, it is prudent to ensure there was sufficient power to minimize the chance of a type 2 error.
Power is directly related to 3 parameters: α, sample size, and effect size. Holding all other parameters constant, increasing α will decrease power. Increasing either sample size or effect size will increase power.
Table 2. The representation of power in the table of possible outcomes of null hypothesis testing. Ho = null hypothesis, α = the probability for making a type 1 error, β = the probability for making a type 2 error.
| Experimenter decision: Do not reject Ho (no difference) |
Experimenter decision: Reject Ho (difference) | |
| Ho True (no difference) | Correct Decision | Type 1 Error (α) |
| Ho False (difference) | Type 2 Error (β) | Correct Decision **Power (1-β)** |
The relationship between power, β, and α is shown below.

Statistical analysis procedure
Choosing an appropriate statistical test depends on the research question, research design and the type of variables measured. In sample size analysis, utilizing a repeated measures design (e.g. pre-test, post-test design), quantitative independent variables, fewer independent variables (fewer number of hypothesis tested) and the use of blocking variables (measuring covariates) would typically lower the necessary sample size
[2].
Calculating sample size
By knowing the effect size, significance level, power level and statistical analysis procedure, one can calculate the sample size. Sample size calculations can be done with statistical charts or software (such as G*Power). G*power 3 is currently available for free (as of January 31, 2012) at: http://www.psycho.uni-duesseldorf.de/abteilungen/aap/gpower3/download-and-register
[3] .
- G*power 3 screenshots
-
 G*Power 3 screenshot
 -
 G*Power 3 screenshot - Parameter input for two independent means
 -
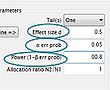 G*Power 3 screenshot - Parameter input for two independent means
 -
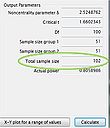 G*Power 3 screenshot - Output for two independent means


References
- ↑ Kotrlik, JW. & Williams, HA. (2003). The Incorporation of Effect Size in Information technology, Learning, and Performance Research. Information Technology, Learning, and Performance Journal. 21(1), 1-7. <http://www.osra.org/itlpj/kotrlikwilliamsspring2003.pdf>.
- ↑ 2.0 2.1 Olejnik, S.F. (1984), Planning educational research: determining the necessary sample size. Journal of Experimental Education, 53, 40-48.
- ↑ Faul, F., Erdfelder, E., Lang, A.-G., & Buchner, A. (2007). G*Power 3: A flexible statistical power analysis program for the social, behavioral, and biomedical sciences. Behavior Research Methods, 39, 175-191.
Additional sources:
Ioannides, J.P.A. (2005). Why most published research findings are false. PLoS Medicine, 2(8), e124, 0696-0701.
Thompson, B. (2002). What future quantitative social science research could look like: confidence intervals for effect sizes. Educational Researcher, 31(3), 25-32.
Cohen, J. (1988). Statistical power analysis for the behavior sciences. Hillsdale, NJ: Lawrence Earlbaum Associates