Course:EOSC 475/ResearchProject/Metatranscriptomics
Angela McLaughlin
Microbial Community Gene Expression in Ocean Surface Waters
Frias-Lopez, J., Shi, Y., Tyson, G.W., Coleman, M.L., Schuster, S.C., Chisholm, S.W., Delong, E.F. 2008. Microbial community gene expression in ocean surface waters. Proc. Natl. Acad. Sci. USA 105: 3805-3810.
INTRODUCTION
- Standing upon the shoulders of previous metagenomic studies and pyrosequencing technology, Frias-Lopez et al. introduce a method of analyzing microbial community gene expression using metatranscriptomics, in which the total microbial community mRNA (metatranscriptome) is compared to the community’s total DNA (metagenome), illustrating patterns of gene expression and regulation dynamics that are not discernible from metagenomic analyses alone. The mRNA amplification techniques were validated using Prochlorococcus cultures for which there exists a large genomic and transcriptomic dataset for comparison. Following pyrosequencing of both total cDNA (derived from mRNA) and genomic DNA, genes were clustered into families through which their expression levels were compared. Among the genes highly represented in the cDNA pool were the metabolic genes, such as those for photosynthesis and nitrogen acquisition, and those encoding hypothetical proteins in the public databases. The variable regions of Prochlorococcus’ genome were highly expressed, suggesting the ecological importance of novel genes in specific genotypes. Gene family clustering revealed patterns of gene expression for individual taxa, specific genes and within protein families. In addition, the analyses revealed a significant fraction of unique gene categories in the cDNA pool that were undetected in previous metagenomic analyses.
MICROBIAL DIVERSITY and CULTIVATION-INDEPENDENT GENOMICS
Gaining Independence
- It is only within the past three decades that our microbiological understanding of the world has surpassed the heavy bias of culture-based methods. Since Antonie van Leeuwenhoek first observed a microscopic life form in 1663, microbiologists have not only focused their studies on bacteria that could be grown on culture and observed through a microscope, but they assumed that this was a complete representation of the microscopic world (Handelsman, 2004). There are a multitude of reasons why bacteria may not be able to grow on standard media including insufficient nutrients, growth surfaces, or symbionts as found in situ, incorrect combinations of temperature, pressure, and gas composition, as well as excess waste products or inhibitory compounds (Handelsman, 2004). Petri dishes do not mimic the complexity of the ecosystems in which microorganisms are found. As our ability to visualize, extract, purify, and sequence DNA improved, it became increasingly apparent that all previous estimations of microbial diversity were biased towards bacteria that are able to grow on standard media.
- One of the first indications that culture-based counts were an inaccurate estimate of total diversity was the discrepancy between dilution plate counts and microscopic counts of cells stained with acridine orange. For instance, in aquatic environments, Grimes et al. found that the two respective counts differed between four and six magnitudes (1986). As further proof of the insufficiency of culture-based counts, Torsvik et al. determined that the culture-based estimate of soil microbial community DNA represented only 0.1%-1% of the DNA heterogeneity that they measured based on the reassociation rate of DNA (1990).
- Carl Woese sparked a new direction in genetic phylogeny when he suggested that genes for ribosomal RNA could be used as an evolutionary chronometer (1987). Lane et al. built upon Woese’s discoveries - by reverse-transcribing RNA preparations, then adding synthetic oligodeoxynucleotide primers that were complementary to conserved regions within the 16S rRNA sequences, they were able to rapidly select 16S rRNA from large quantities of cellular RNA (1985). Other research focused on the direct sequencing of 5S rRNA (Stahl et al., 1985). The polymerase chain reaction as developed by Kary Mullis’ group, Saiki et al. (1988), further accelerated the discovery of new taxa - specific primers for the conserved rRNA sequence facilitated the rapid amplification of the 16S rRNA gene across multiple taxa. In the Sargasso Sea, for instance, Giovanni et al. used PCR to discover an assemblage of organisms with far more diversity than previously expected, based upon the variation in their PCR-amplified 16S rRNA sequences (2005).
- Although 16S rRNA sequencing revolutionized scientists’ understanding of the complex phylogenetic diversity of the microbial world, it did not provide a comprehensive understanding of the rest of the genome. The metabolism, biochemistry, and physiology of the newly illuminated microorganisms and the communities from which they are found in situ were yet to be described and compared.
Metagenomics and High-Throughput Sequencing
- The sequencing of a single type of gene, the 16s rRNA, from a community inevitably developed into the sequencing of an entire community’s DNA content, a technique now referred to as metagenomics, once the resources and technological advancements became available to do so. Genetic analyses were no longer restricted to comparing the taxonomic variation in the 16S rRNA of organisms; now researchers could compare the associated metabolic and physiological capabilities of various organisms and communities. The emergence of metagenomics has fostered a new understanding of the abundance, distribution, variation, and functional significance of microbial genes (Frias-Lopez et al., 2008). In addition, new genes and gene products were discovered in this way, such as the ubiquitous proteorhodopsin protein family identified by Beja et al. (2001). The term metagenomics can be considered synonymous to community genomics, environmental genomics, and population genomics (Handelsman, 2004). The term itself was coined to denote the analysis of similar, but distinct items, in this case, genes (Handelsman, 2004).
- In its early stages, metagenomics relied upon cloning the environmentally-extracted DNA into vectors – either phage or BAC - that could be transformed into bacteria for storage, amplification, and in some cases, functional analysis. Schmidt et al. were the first to directly clone environmental DNA into phage vectors and then transform the clones into E.coli cells (1991). The work of Stein et al. built upon the method, cloning prokaryotic DNA from seawater into a BAC genomic library, in the process, discovering a new archaea species based on the 20kb clone of its 16S rRNA gene (1996). Once a clone library is created, the clones can either be screened for phylogenetic markers and other conserved sequences by hybridization or multiplex PCR, or screened for enzymatic or antibiotic activity (Handelsman, 1998). Alternatively, clones can be analyzed based on their sequences (Venter et al., 2004; Rusch et al., 2007), as has become increasingly popular in contemporary research.
- The ambitious environmental shotgun sequencing project embarked upon by Venter et al. set a high standard for high-throughput metagenomic analyses (2004). Gone are the days when sequencing a single organism’s genome would be considered a feat. Venter et al. analyzed 1.045 billion base pairs of nonredundant sequences, deriving information about gene presence, abundance, and variety, as well as the relative abundance of species in the Sargasso Sea (2004). In effect, they discovered 148 previously unknown bacterial phylotypes, as well as 1.2 million previously unknown genes. This was one of the first overwhelming contributions made to a public gene bank by a single metagenomic assembly (Handelsman, 2004). By assembling the sequences into a large set of deep, non-repetitive contig scaffolds, they were able to cluster and categorize assemblies by organisms (Venter et al., 2004). Their algorithms for gene analysis illustrate a more comprehensive method of studying gene and species diversity within environmental biology. Venter et al. identify the challenges of metagenomic analyses such as improper scaffolding assembly due to the cross-species homology of conserved regions, the under-representation of less abundant organisms, and the high cost of sequencing vast amounts of genomic data (2004). Additionally, preparing clone libraries has its associated biases that are avoided altogether when the cDNA derived from mRNA can be directly sequenced, as demonstrated by Frias-Lopez et al. (2008).
- The Sorcerer II Global Ocean Sampling (GOS) expedition embarked upon by Rusch et al. also contributed a massive amount of genomic and hypothetical protein data to the current public database, doubling the number of predicted protein sequences available to the public (2007). The GOS database they established covers nearly all known prokaryotic protein families (Yooseph et al. 2007). The comparative genomic and assembly methods they developed are widely used in contemporary metagenomic and metatranscriptomic studies. When a substantial scaffold assembly for a given genome was not possible, “fragment recruitment” through comparison to established databases facilitated the understanding of genomic structure, evolution, and diversity, as well as biochemical diversity of gene families (Rusch et al., 2007). Another pioneering method, namely “extreme assembly”, allowed them to reassemble large portions of the genome of rare organisms in the community (Rusch et al., 2007). Their assembly of predicted proteins in the environment also contributed to our knowledge of the diversity of known protein families and their evolution (Yooseph et al. 2007).
- Although other research groups had published results from cultivation independent genomic surveys, DeLong et al. were the first to undertake a genomic analysis along a well-defined environmental gradient (2006). Through metagenomic analyses of planktonic microbial communities along a 4000m deep water column in the North Pacific Subtropical Gyre, they recognized vertical gene distribution patterns. The taxonomic composition of the community at each depth was determined by sequencing all of the small subunit 16S ribosomal RNA genes in the clone libraries. The phylogenetic distribution was similar to what would be expected based on the abiotic conditions at each depth: light, salinity, temperature, nutrient concentrations, pressure, and trace metal concentrations. The fosmids from the gene clone libraries that Delong et al. obtained were compared to existing databases – the Kyoto Encyclopedia of Genes and Genomes (KEGG), the National Center for Biotechnology Information (NCBI), and SEED subsystems – using BLAST searching. By comparing the genes to established databases and clustering genes according to their likely function, they were able to gain insight into the community’s potential metabolic and physiological capabilities at each depth. DeLong et al.’s pioneering methodology and analysis sets the standard for metagenomic analyses, and serves as a base for metatranscriptomic analyses, which are most relevant when done in conjunction with metagenomics.
- Beyond taxonomic categorization and the genetic profiling of uncultured organisms’ or communities’ metabolic capabilities, an additional application of metagenomics is the comparison of a cultured species’ known attributes and distribution to its genetic profile as obtained through metagenomics. Coleman and Chisholm used a metagenomic approach to clarify the relationship between the ecology of genes, organisms, and ecosystems using Prochlorococcus as a model organism (2007). They compile and analyze metagenomic data for various Prochlorococcus ecotypes that Frias-Lopez et al. used as a means of validating their methodology. They foresaw and supported the emergence of metatranscriptomics in their conclusions.
- In the past, the efficiency and depth of metagenomics has been limited by the efficiency and affordability of the sequencing technology available at the time. The Sanger enzymatic dideoxy method and the Maxam and Gilbert chemical degradation methods, both described in 1977, were the techniques of choice for many years (Ansorge, 2009). Both methods were limited by short reads, and the number of sequences they could process per reaction (Ansorge, 2009). Paired end sequencing, automated-fluorescence based sequences, and later in 1997, high-throughput automated capillary sequencers were offshoots of the original Sanger method that proved to be more feasible for sequencing entire genomes (Ansorge, 2009). The development of pyrosequencing technology, notably the 454 GenomeSequencer FLX instrument by Roche, accelerated genomic studies drastically, to the point where researchers can now sequence 400-500bp reads, with a total output of up to 500 million bp with the new 454 FLX Titanium upgrade (Ansorge, 2009). Another notable sequencing technology, the Illumina (Solexa) Genome Analyzer, can sequence at least 3 Gbp of data in a paired-end run and record data from more than 50 million reads per flow cell (Ansorge, 2009). In 2007, the Applied Biosystems ABI SOLiD system was developed which despite its relatively smaller read length of approximately 35 bp has a low error rate and has a high throughput of several Gbp per run (Ansorge, 2009). These techniques stand in stark contrast to previous sequencing techniques, which were laborious, inefficient, expensive, and not as consistent. An enormous quantity of sequence information is available in open public databases such as the GenBank, the Kyoto Encyclopedia of Genes and Genomes (KEGG), the National Center for Biotechnology Information (NCBI) and recently the GOS peptide database, as developed by Yooseph et al. (2007)
- Clearly the challenge confronting scientists is now how to store, categorize, interpret, and analyze this vast quantity of sequence information. And although genomic sequence data tells us what an organism or community is capable of expressing as proteins, the data gains meaning and scope when compared to the transcriptomic data which enlightens us as to which genes are being expressed in a given environment at a given time and to what extent they are transcribed.
Metatranscriptomics
- Despite all of its successes, metagenomic analyses shed no light on gene expression dynamics. The presence of a gene does not imply that it is expressed, especially at a functionally significant level. Furthermore, metagenomics fail to reveal how gene expression in different species and gene families varies spatially and temporally. Metatranscriptomic analyses of microbial community mRNA done in conjunction with metagenomic analyses of the same microbial community illuminate previously neglected patterns of gene expression dynamics, giving meaning and scope to genomic data sets.
- Prior to the emergence of metatranscriptomics, quantitative RT-PCR was used as a method of quantifying the transcripts present in a environmental sample. This method, however, was limited to quantifying the sequences that could be targeted with specific primers, ignoring any genes that had not yet been discovered or that exhibited considerable variation (Frias-Lopez et al., 2008).
- Poretsky et al. were among the first groups to undertake a comprehensive metatranscriptomics project, using ribosomal RNA subtraction along with RT-PCR to create cDNA clone libraries derived from the microbial community mRNA sample (2005). Their experiment, however, included inherent problems such as skewed relative abundance of sequences due to cloning, large sampling volumes, and long sampling time (Frias-Lopez et al. 2008). Their methodology helped to pave the way for Frias-Lopez et al., by establishing, for instance, the RNA subtraction method used to isolate mRNA from total community RNA (Poretsky et al., 2005).
METHODOLOGY – Sampling, mRNA isolation and amplification, and sequencing
- Frias-Lopez et al.’s methodology is a synthesis and evolution from previously developed solutions to overcome the challenges associated with isolating and amplifying mRNA from natural microbial communities. Firstly, the short half life and relatively low concentration of mRNA in environmental samples emphasizes the necessity of an effective mRNA amplification technique. Wendisch et al. developed a method to overcome the challenge of isolating bacterial mRNA – a method previously exclusive to eukaryotic cells due to lack of a poly(A) tail on bacterial mRNA - from crude RNA extracts (2001). By treating mRNA with Escherichia coli poly(A) polymerase, which preferentially adenylates mRNA, they facilitated its isolation from bacterial cells for the purpose of amplification and analysis. Ambion adapted this method into a commercially available kit which also includes a linear amplification step using T7 RNA-polymerase. The ribosomal RNA subtraction method developed by Poretsky et al. contributes to the isolation of mRNA from a mix of nucleic acids in the sample (2005). Rachman et al. were among the first who adapted the polyadenylation-dependant RNA amplification method to study cultured microbes in a single genome microarray (2006). By validating the method for single genomes besides E.coli, they laid a foundation for mixed population microbial RNA analysis. The data produced by microarray analyses was limited in the sense that information was only provided about the known sequences for which it was designed, neglecting novel sequences and the diversity inherent in microbial ecosystems.
- Frias-Lopez et al. combined the techniques that were previously developed in order to synthesize cDNA from small quantities of mixed population microbial mRNA. After extracting the nucleic acid from the environmental sample, they used the RNA subtraction method developed by Poretsky et al. (2005), then amplified mere nanograms of polyadenylated community mRNA with T7 RNA polymerase before converting it to cDNA, then immediately pyrosequenced it with a Roche GS20 DNA sequencer alongside genomic DNA from the same sample. In order to minimize the effect of an organisms’ representation on the interpretation of a cDNA molecule’s abundance, the number of cDNA copies was normalized to corresponding gene copy numbers in the DNA pool.
- The fidelity, or reliability, of the mRNA amplification method was assessed using Procholoroccus cultures, for which a large database exists representing the Subtropical Gyre, in particular. For protein coding genes, the level of expression of amplified Procholoroccus RNA was very similar to the level of gene expression in unamplified RNA. An independent assessment of the technique by Martiny et al. confirmed that linearly amplified RNA from strain MIT9313 displayed comparable up-regulation of genes for phosphate acquisition to non-amplified RNA when starved of phosphate (2006). Further, rRNA transcripts were consistently under-represented in the amplified RNA, supporting the preferential adenylation of mRNA.
RESULTS AND DISCUSSION
- The methodology developed by Frias-Lopez et al. is used to analyze gene expression across a microbial community, analyze the taxonomic origin of the genes expressed, and examine gene expression of Prochlorococcus as a means of validating their technique.
Field Testing Microbial Gene Expression Profiling in the Open Ocean
- The open ocean sample was taken from a depth of 75m at Hawaii Ocean Time Series (HOT) station ALOHA in the North Pacific Subtropical Gyre, in which Prochlorococcus makes up a large fraction of the microbial community. The cDNA and DNA sequences were compared to the NCBI-nr (National Centre for Biotechnology Information nonredundant) protein database and to the GOS (Global Ocean Sampling) metagenomic dataset established by Rusch and colleagues (see Table 1).

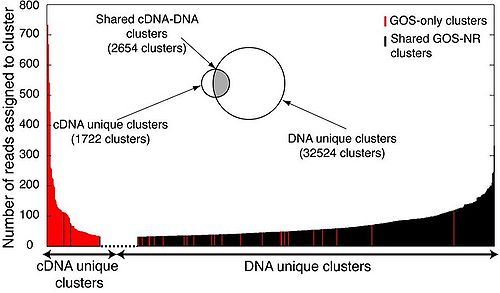
- As expected, there are a larger number of GOS peptide matches because the GOS data are derived from similar microbial communities and contains more total protein sequences than the NCBI-nr. The low percentage of matches for cDNA in both the NCBI-nr and GOS peptide database suggests the presence of rare or unique genes in the cDNA pool that have not been detected in previous metagenomic surveys. Sequence reads from both cDNA and genomic DNA pools were assigned to GOS protein clusters in order to assess the representation of protein families (Fig. 1A).
alt text

Fig. 1A. Community-level gene expression profile based on GOS peptide database. GOS protein clusters with DNA or cDNA matches at bit scores >40 are shown in the Venn diagram. Numbers of reads assigned to GOS protein clusters, when >70, are plotted for both cDNA-unique protein clusters and DNA-unique protein clusters. GOS protein clusters shared by DNA and cDNA libraries (shaded in gray) were further illustrated in B.
- Since the cDNA reads are an eighth of the number of DNA reads after removing rRNA sequences, the smaller number of cDNA protein cluster assignments (2654) than DNA protein cluster assignments (32524) is expected. What is not expected is that 40% of the cDNA protein clusters did not overlap with those of the DNA library, suggesting under-sampling of diversity in both the cDNA and DNA pools. Other large scale metagenomic studies also find a linear increase in the rate of recovery of GOS protein clusters with increasing numbers of sequence reads for both cDNA and DNA. The 2654 shared cDNA and DNA clusters were further analyzed by calculating the cluster-based expression ratios (number of cDNA reads matching a given GOS protein cluster divided by the number of DNA reads matching the same protein cluster), allowing Frias-Lopez et al. to look at the expression profile at the level of protein family without losing any data resolution. Traditionally, short pyrosequenced reads would have been segmented into what appears to be distinct, non-related clusters which may have been derived from the same gene. The cluster-based expression ratio bypasses this convention. Protein clusters with the highest cluster-based expression ratios (lots of cDNA per corresponding DNA) were associated with the low DNA abundance category, which were mostly from the hypothetical proteins found only in the GOS peptide database. This finding confirms that many of the predicted hypothetical proteins from the GOS database are actively expressed in situ and play a relevant environmental role. Moreover, the high expression of cDNA unique clusters implies that the cDNA analysis presents novel genes with potentially important ecological functions that have been bypassed by previous metagenomic analyses. Contemporaries, Shi et al., hypothesize that many of these transcripts may be putative small RNAs (2009).
Highly Expressed Gene Categories in Known Metabolic Pathways
alt text

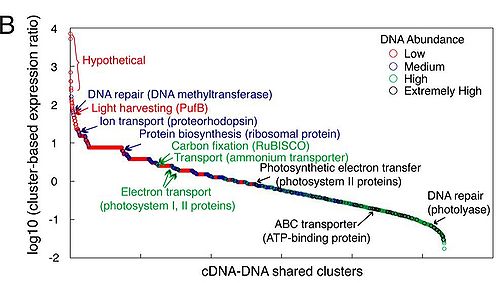
Fig. 1B. Community-level gene expression profile based on GOS peptide database. GOS protein clusters shared by cDNA and DNA libraries were ranked by their cluster-based expression ratio (representation of each cluster in the cDNA library normalized
by its representation in the DNA library). Furthermore, each protein cluster was categorized (and color-coded) according to its abundance in the DNA library. Representative protein clusters were highlighted from each category and discussed in the text.
- Cluster-based expression ratios draw attention to the genes that are most highly expressed – providing insight into which microbial processes are active and important. Among the genes that were highly expressed and were comparable to number of gene copies in genomic DNA (cluster ratio close to 1): genes related to oxygenic phototrophy such as those coding for ribulose biphosphate carboxylase (RuBisCo), large subunit (rbcL) homolog (enzyme for carbon fixation in the Calvin cycle), and glutamine synthase (nitrogen metabolism). Genes with high cluster ratios – high expression level, but low number of copies in genomic library – included those related to alternative phototrophy such as light harvesting protein β-chain (PufB), photosynthetic eaction center cytochrome C subunit (PufC), and chlorophyllide reductase subunit Y (BchY) – all derived from an Alphaproteobacter closely related to Roseobacter. The high ratio supports the notion of aerobic anoxygenic phototrophy’s ecological importance. Proteorhodopsins were abundant in both cDNA and DNA libraries. The taxonomic origins of the expressed proteorhodopsin genes were diverse, emphasizing the ecological importance of these light-driven proton pumps.
Putative Taxonomic Origins of Expressed Genes
alt text

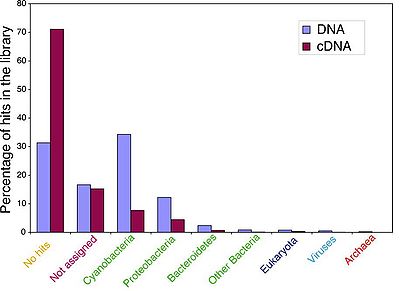
Fig. 2. Distribution of different phylogenetic groups in DNA and cDNA libraries. Percentages of the different phylogenetic groups were calculated from the MEGAN analysis results at the phylum level cutoff. Not assigned reads are sequences with an NR hit but a bit score >40.
- It is challenging to infer genes’ phylogenies based on metatranscriptomic data because the analysis and categorization of genes is dependant upon the length of the sequence reads, the conservation of genes across taxa, the depth of taxonomic sampling, and the taxon richness. Frias-Lopez et al. used MEGAN software to assign putative taxonomic origins based on BLAST outputs and NCBI taxonomy. Genes from both libraries mostly originated from Prochlorococcus and Alphaproteobacter (pelagibacter), as expected based on what we know of their abundance in oligotrophic ocean. They also detected a significant number of genes of viral origin, suggesting that there were cells which were actively infected by viruses during sampling. The percentage of DNA and cDNA hits for a given taxa was generally comparable, with the exception of the Cyanobacteria group, for which there were triple the percentage of DNA hits than cDNA hits.
Evaluating Gene Expression in a Naturally Occurring Prochlorococcus Assemblage
- More than 90% of putative Prochlorococcus sequence reads shared highest similarity to strains MIT9301, AS9601, MIT9321, as is consistent with independent analyses of ecotype distribution at this depth, such as the Atlantic ecotype distribution experiment conducted by Johnson et al. (2006). For Prochlorococcus, there was a high abundance of cDNA copies for genes for ammonium uptake (amt), photosynthesis (psaAB), and carbon fixation (rbcL) genes. High representation in the cDNA library confirms that these proteins are important in biogeochemical processes. Also, the high expression of hypothetical proteins further affirms that they are indeed expressed in situ. The 1250 core genes of Prochlorococcus were represented equally in all taxa, whereas genes from the “flexible” genome of MIT9301 were variably represented. Several of the flexible genes found on genomic islands in MIT9301 were strongly expressed, serving as an indication of their functional importance.
Challenges of Microbial Community Transcriptomics
- Obtaining and interpreting metatranscriptomic data introduces many challenges, as recognized by Frias-Lopez et al.. They acknowledge that the diversity and complexity of microbial communities hinders any single sample from accurately and comprehensively representing the ocean. The unique genes discovered in this study alone indicate that genetic diversity in situ far surpasses our current knowledge. In effect, the metagenomic databases (NCBI and GOS) are not entirely comprehensive and therefore prevent a total transcriptional or genomic comparison among communities. Many reads from both the DNA and cDNA libraries in this study were not previously represented in the available databases. Furthermore, field sampling logisitics introduce many sources of variation in terms of the transcripts represented in the sample. The time of day, month, and year, the tide, the weather, the depth, any disturbances, and the multitude of other variables in an ocean ecosystem affect any given organisms’ gene regulation and dynamics.
- In addition to sampling variation and lack of reproducibility, mRNA syntheses and degradation rates vary for specific sequences depending upon their chemical structure stability. In effect, the more stable a given mRNA molecule is, the more likely it is to be represented in the metatranscriptomic dataset. Generally, the more rapid the collection and the smaller the volume, the better, since mRNA degradation is less likely to favour stable mRNA molecules. Frias-Lopez et al.’s experiment filters in 15 minutes and used 1L, which is an improvement over previous studies, but does leave room for improvement. There is also room for amelioration in the mRNA enrichment step. Only ~50% of cDNA represented mRNA sequences, rRNA sequences were not entirely excluded.
- Besides the logistics of sampling and obtaining mRNA, the methodology used to sequence, digest, reassemble, annotate, and analyze cDNA greatly affects the results. The sequencing technology determines the sequence read size and therefore determines how effectively a genome can be reassembled and the degree of similarity between reads and the databases at hand. Longer sequence reads are desirable because they are more informative and facilitate better annotation. Sequence reads were an average of 96bp in this experiment, which is sufficient to assign reads to specific genes and ecotypes in Prochlorococcus, but 100bp is not sufficient for accurately assigning genes to uncultivated microbes. With the new improvements in pyrosequencing, reads up to 500bp can be obtained, improving the accuracy and precision of analyses. In addition, the target gene size selected for comparing the reads to the database also provides a source of result variation. In terms of analysis, the specific method used for gene annotation and the degree of similarity required to be considered a hit will also affect the results.
- Although metatranscriptomic studies do provide additional insight into the dynamics of gene regulation and relative abundance of transcripts in situ, another piece of the picture is required for a true representation of gene expression – proteomics. Only when the three methods are used simultaneously can we truly predict holistic in situ responses to environmental fluctuation over time and space.
CONTEMPORARY RESEARCH
Improvements in mRNA Enrichment and Reproducibility
- The conclusions and methodologies of Frias-Lopez et al. were elaborated upon by Gilbert et al. (2008). They, for instance, improved mRNA enrichment from total RNA up to 99.92% as compared to the 50% enrichment achieved by Frias-Lopez et al.. Moreover, they took duplicate samples from two time points in order to assess reproducibility. They support Frias-Lopez et al.’s conclusion that a large proportion, 91% in this case, of the mRNA sequence reads are novel, in other words are not found in current genomic databases. Their findings increasingly support the feasibility of metatranscriptomics, when done alongside metagenomics, to study the regulation and expression of genes in microbial communities.
Temporal Variation of the Metatranscriptome
- As mentioned previously, gene dynamics over spatial and temporal ranges can be compared using metatranscriptomics. Poretsky et al. use metatranscriptomics to compare gene expression in day time and night time (2009). In doing so, they elucidate how metabolic and biogeochemical activities vary over a 24 hour period. Samples were taken from the surface water at the Hawaiian Ocean Time-Series station, the same site as for the Frias-Lopez experiment. During the daytime, they found that the transcripts of genes involved with photosynthesis, heterotrophic C1 metabolism, and oxidative phosphorylation were more abundant than at night, supporting the notion that solar radiation levels drive energy acquisition for both autotrophic and heterotrophic bacteria. Transcripts involved in protection or repair of light-induced DNA and protein damage, such as photolyases, were also more abundant in the day time. The night transcriptome revealed high levels of transcripts for amino acid biosynthesis, membrane synthesis and repair, and vitamin biosynthesis – housekeeping activities were more active when solar radiation levels were low. See File:HOT table.pdf. Overall, the community’s activity was focused on energy acquisition and metabolism by day, and the biosynthesis of vitamins, membranes, and amino acids by night. Poretsky et al. provide a new dimension of understanding to the temporal pattern of gene expression in microbial communities, and supply a new type of data for predicting how environmental factors affect an ecosystem’s dynamics.
Putative Small RNAs Among the "Unique" cDNA Sequences
- Shi et al. pursued a lingering mystery from Frias-Lopez et al.’s work – how does one explain all the cDNA sequences that share no significant homology with known peptide sequences (2009)? Frias-Lopez et al. claimed that the transcripts represented uncharacterized proteins that have escaped previous metagenomic databases (2008), whereas Shi et al. reported that a large portion of the cDNA sequences from the metatranscriptomic study represent well known small RNAs (sRNAs), and some new groups of previously unrecognized putative sRNAs (psRNAs) (2009). sRNAs are untranslated short (50-500 nucleotides) transcripts that are usually found within intergenic regions on microbial genomes. They mostly function as regulators, often for environmentally significant processes including amino acid and vitamin biosynthesis, photosynthesis, and quorum sensing (Shi et al., 2009). There is still much to be learned regarding their diversity and ecological relevance in microbial communities. The psRNAs from Frias-Lopez et al.'s metatranscriptomic data were mapped to intergenic regions of genomes derived from similar habitats, were found to have a conserved secondary structure, and were often flanked by genes, indicating the psRNA may be regulating the gene. In addition, the psRNAs were vertically distributed in a pattern mimicking the known distribution of taxonomic groups. The psRNAs also varied in minor ways at the micro level within closely-related populations, hinting that their regulatory function may facilitate populations to adapt to specific niches. Shi et al. delved deeper into mapping the genome of a subset of psRNAs derived from predominant planktonic species, including Pelagibacter, revealing potentially new regulatory elements (2009). Overall, their analyses highlight the importance of sRNAs in metatranscriptomic data sets, since they reveal information about the diversity and distribution of taxonomic groups, as well as play key roles in the regulation of environmentally important processes (Shi et al., 2009).
Metatranscriptomic Analyses of an Oxygen Minimum Zone
- Stewart et al. applied metatranscriptomics to an oxygen minimum zone (OMZ) in the Eastern Tropical South Pacific off the North coast of Chile, sampling from four depths that crossed the oxycline into the upper OMZ (2012). By characterizing the dynamics of gene regulation in the environment, as well as deriving taxonomic and ecotype distribution data, they illuminate the ecosystem’s biogeochemical dynamics. They, too, found a significant discrepancy between the community’s metabolic potential in the form of DNA clusters, and the actual genes that were transcribed and clustered by their cDNA. BLAST searches revealed that the majority of the transcripts at all the depths were related to the nitrogen cycle, whether they were genes involved with annamox and denitrification (reduction) or nitrification (oxidation). In the upper three depths, 50m, 85m, and 110m, many transcripts matched the genome of the ammonia-oxidizing archaeon Nitrosopumilus maritimus. Furthermore, transcripts for ammonia monooxygenase genes were most abundant in the upper three depths, which were dominated by archaeal RNA, despite being represented by both bacterial and archaeal sequences in the community DNA. Whereas at the lower depth, 200m, where there was no oxygen available, one in twelve transcripts matched the genome of the anammox bacterium Kuenenia stuttgartiensis. Stewart et al. bring to light expression patterns for specific genes along the community’s depth profile, as well as point out the key functional groups for profiling taxa based on their genome (2012).
PROSPECTS
- As high-throughput sequencing of community DNA and mRNA, as well as characterization of community proteins, becomes increasingly affordable and efficient, the challenge shifts from how to collect this data, to how to analyze and interpret this data in a comprehensive and meaningful way.
- It is clear that the public genomic and predicted protein databases such as Genbank, SEED, KEGG, GOS, and NCBI need to expand their genomic scope to include more representatives from each taxon and from a wider variety of sample locations. Although it would be ambitious, synchronizing them into a single, all-encompassing database with information from genes, to transcripts, to proteins in their relative abundances and with associated statistics such as GC content, variability, and regulatory factors seems like a logical way to go if it is indeed feasible. A dataset of that magnitude would, however, require an enormous storage capacity, as well as complex heuristic algorithms to store, sort, weigh, and synthesize sequence information.
- There is still room for improvement in the current high-throughput sequencing technology. New automated sequencers provide increasingly longer reads, increasingly larger total outputs per reaction, and a lower error rate. The technological advancements seem to be accelerating as more people are shifting their focus to the development of this technology. Some of the best current models include the new 454 FLX Titanium upgrade that produces 400-500bp reads, with a total output of up to 500 million bp, and the Illumina (Solexa) Genome Analyzer that can sequence at least 3 billion bp in a paired-end run and record data from more than 50 million reads per flow cell (Ansorge, 2009). Compared to 50, even 15 years ago, this drastically improves researchers’ sequencing ability and capacity, as well as facilitates rapid development in many domains of biological sciences. Once the initial capital costs of these machines are covered, the price of sequencing is relatively cheap. The feasibility of wide scale meta-studies has greatly advanced, no longer limited by technology or affordability. The longer the sequence reads become, the more accurately genomes can be reassembled and compared to the databases, and the more power metagenomic and metatranscriptomic analyses will have.
- Meta-studies in all their forms - genomic, transcriptomic, or proteomic - rely upon comparisons in their analyses of data to draw conclusions. Choosing what to compare is the challenge. Clearly it is convention to compare the data to the most comprehensive database at hand, but identifying a predicted protein in a given sample at a given time is not particularly informative. Comparisons among communities, taxonomic groups, spatial distributions both vertical and horizontal, temporal scales - as done by Poretsky et al. (2009) - and within a community in response to environmental changes are far more informative. Seeing how the dynamics of gene expression vary among these comparisons will allow us to predict more effectively the consequences that environmental changes, such as ocean acidification and global warming for instance, will have on gene expression, and therefore upon the biogeochemical cycles with which these microbes are inextricably united.
- Microbial diversity in ocean, soil, gut, and various other ecosystems remains largely underestimated and significantly misunderstood. The complex dynamics and interconnectedness of natural systems is far from the controlled petri dish in which our microbiological understanding was cultivated. Culture-independent studies of genomic diversity and variation are still in their early stages of development and have promising prospects for our future understanding of the complex microbial world.
REFERENCES
Ansorge, W.J. 2009. Next-generation DNA sequencing techniques. New Biot. 25: 195-203.
Beja, O., Spudich, E.N., Spudich, J.L., Leclerc, M., DeLong, E.F. 2001. Proteorhodopsin phototrophy in the ocean. Nature 411: 786–789.
Coleman, M.L., Chisholm, S.W. 2007. Code and context: Prochlorococcus as a model for cross-scale biology. Trends Microbiol. 15: 398–407.
DeLong, E.F., Preston, C.M., Mincer, T., Rich, V., Hallam, S.J., Frigaard, N., Martinez, A., Sullivan, M.B., Edwards, R., Brito, B.R., Chisholm, S.W., Karl, D.M. 2006. Community genomics among stratified microbial assemblages in the ocean’s interior. Science 311: 496–503.
Gilbert, J.A., Field, D., Huang, Y., Edwards, R., Li, W., Gilna, P., Joint, I. 2008. Detection of large numbers of novel sequences in the metatranscriptomes of complex marine microbial communities. PLoS ONE 3: e3042.
Giovannoni, S. J., Britschgi, T. B., Moyer, C. L., Field, K. G. 1990. Genetic diversity in Sargasso Sea bacterioplankton. Nature 345: 60-63.
Handelsman, J., Rondon, M. R., Brady, S. F., Clardy, J., Goodman, R. M. 1998. Molecular biological access to the chemistry of unknown soil microbes: a new frontier for natural products. Chem. Biol. 5: R245-R249.
Handelsman, J. 2004. Metagenomics: Application of genomics to uncultured microorganisms. Microbiol. Mol. Biol. Rev. 68: 669-685.
Johnson, Z.I., Zinser, E.R., Coe, A., McNulty, N.P., Woodward, E.M., Chisholm, S.W. 2006. Niche partitioning among Prochlorococcus ecotypes along ocean-scale environmental gradients. Science 311: 1737–1740.
Lane, D. J., Pace, B., Olsen, G. J., Stahl, D. A., Sogin, M. L., Pace, N. R. 1985. Rapid determination of 16S ribosomal RNA sequences for phylogenetic analyses. Proc. Natl. Acad. Sci. USA 82: 6955-6959.
Poretsky, R.S., Bano, N., Buchan, A., LeCleir, G., Kleikemper, J., Pickering, M., Pate, W.M., Moran, M.A., Hollibaugh, J.T. 2005. Analysis of microbial gene transcripts in environmental samples.Appl. Environ. Microbiol. 71: 4121–4126.
Poretsky, R.S., Hewson, I., Sun, S., Allen, A.E., Zehr, J.P., Moran, M.A. 2009. Comparative day/night metatranscriptomic analysis of microbial communities in the North Pacific subtropical gyre. Environ. Microbiol. 11: 1358-1375.
Rachman, H., Lee, J.S., Angermann, J., Kowall, J., Kaufmann, S.H. 2006. Reliable amplification method for bacterial RNA. J. Biotechnol. 126: 61–68.
Rusch, D.B., Halpern, A.L., Sutton, G., Heidelberg, K.B., Williamson, S., Yooseph, J., Wu, D., Eisen, J.A., Hoffman, J.M., Remington, K., Beeson, K., Tran, B., Smith, H., Baden-Tillson, H., Stewart, C., Thorpe, J., Freeman, J., Andrew-Pfannkoch, C., Venter, J.E., Li, K., Kravitz, S., Heidelberg, J.F., Utterback, T., Roger, Y., Falcon, L.I., Souza, V., Bonilla-Rosso, G., Eguirate, L.E., Karl, D.M. Sathyendranath, S., Platt, T., Bermingham, E., Gallardo, V. Tamayo-Castillo, G., Ferrar, M.R., Strausberg, R.L., Nealson, K., Friedman, R., Frazier, M., Venter, J.C. 2007. The Sorcerer II global ocean sampling expedition: Northwest Atlantic through Eastern Tropical Pacific. PLoS Biol 5: e77.
Saiki, R.K., Gelfand, D.H., Stoffel, S., Scharf, S.J., Higuchi, R., Horn, G.T., Mullis, K.B., Erlich, H.A. 1988. Primer-directed enzymatic amplification of DNA with a thermostable DNA polymerase. Science 239: 487–491
Schmidt, T. M., DeLong, E. F., Pace, N. R. 1991. Analysis of a marine picoplankton community by 16S rRNA gene cloning and sequencing. J. Bacteriol. 173: 4371-4378.
Shi, Y.M., Tyson, G.W., DeLong, E.F. 2009. Metatranscriptomics reveals unique microbial small RNAs in the ocean's water column. Nature 7244: 266-U154.
Stahl, D. A., Lane, D. J., Olsen, G. J., Pace N. R. 1985. Characterization of a Yellowstone hot spring microbial community by 5S rRNA sequences. Appl. Environ. Microbiol. 49: 1379-1384.
Stein, J. L., Marsh, T. L., Wu, K. Y., Shizuya, H., DeLong, E. F. 1996. Characterization of uncultivated prokaryotes: isolation and analysis of a 40-kilobase-pair genome fragment front a planktonic marine archaeon. J. Bacteriol. 178: 591-599.
Stewart, F. J., Ulloa, O., DeLong, E. F. 2012. Microbial metatranscriptomics in a permanent marine oxygen minimum zone. Environ. Microbiol. 14: 23–40.
Torsvik, V., Goksoyr, J., Daae, F. L. 1990. High diversity in DNA of soil bacteria. Appl. Environ. Microbiol. 56: 782-787.
Venter, J. C., Remington, K., Heidelberg, J.F., Halpern, A. L., Rusch, D., Eisen, J. A., Wu, D., Paulsen, I., Nelson, K.E., Nelson, W., Fouts, D. E., Levy, S., Knap, A. H., Lomas, M. W., Nealson, K., White, O., Peterson, J., Hoffman, J., Parsons, R., Baden-Tillson, H., Pfannkoch, C., Rogers, Y. H., Smith, H. O. 2004. Environmental genome shotgun sequencing of the Sargasso Sea. Science 304: 66-74.
Wendisch, V.F., Zimmer, D.P., Khodursky, A., Peter, B., Cozzarelli, N., Kustu, S. 2001. Isolation of Escherichia coli mRNA and comparison of expression using mRNA and total RNA on DNA microarrays. Anal. Biochem. 290: 205–213.
Woese, C. R. 1987. Bacterial evolution. Microbiol. Rev. 51: 221-271.
Yooseph, S., Sutton, G., Rusch, D.B., Halpern, A.L., Williamson, S.J., Remington, K., Eisen, J.A., Heidelberg, K.B., Manning, G., Li, W., Jaroszewski, L., Cieplak, P., Miller, C.S., Li, H., Mashiyama, S.T., Joachimiak, M.P., Van Belle, C., Chandonia, J., Soergel, D.A., Zhai, Y., Natarajan, K., Lee, S., Raphael, B.J., Bafna, V., Friedman, R., Brenner, S.E., Godzik, A., Eisenberg, D., Dixon, J.E., Taylor, S.S., Strausberg, R.L., Frazier, M., Venter, J.C. 2007. The Sorcerer II global ocean sampling expedition: Expanding the universe of protein families. PLoS Biol 5: e16.