Course:Cons452
Introduction

CONS 452: Global Perspectives Capstone
Navigating the transition to a sustainable world is humanity’s current challenge. This will require fostering resilient interacting systems of people and ecosystems (resilient social-ecological systems). In this course, students will utilize a suite of tools and ideas useful in managing ecosystem services in a sustainable way. Each week we focus on a different theme related to sustainability and resilience, and work as small teams to apply these ideas to a set of diverse landscapes throughout the world.
Many of the lab exercises and group projects involve “hands-on” spatial analysis of land cover change using GIS and remote sensing. We also assess socio-economic data to examine issues such as forest use. These quantitative approaches help us move beyond arm-waving about sustainability to making some tough choices, using the best available scientific information.
SDG Resources
The course is oriented around the Sustainable Development Goals: 17 global goals (agreed upon by world leaders) to be achieved by 2030. You can access more information about the SDGs here:
- Sustainable Development Goals
- A new open-access book on forests and the SDGs: "Sustainable Development Goals: their impacts on forests and people"
- A policy-brief on "Harnessing forests for the Sustainable Development Goals" by IUFRO
- SDGs on Wikipedia
Finding Data
Understanding data
The group projects for CONS452 may rely on a variety of data types, depending on the context of the problem. Going about data collection is often challenging, and the approach not only depends upon your knowledge of different data sources, but also on the nature of your research question. The graphic below could be a useful guide for conceptualizing going about data collection. For this course we will not collect primary data but rather rely on secondary data, and this process will be iterative. This means that you will start by coming up with a question and looking for data to help you solve it. If the exact data for your question is not available, then you must shift your question. Alternatively, a dataset may inspire you to think of a question, and it may be completely unrelated to your original idea!
Data may vary in their content, collection methods, scale, and formats. There are:
- Primary vs. secondary data
- Qualitative vs. quantitative data
- Observational vs. experimental data
- Cross-sectional vs. longitudinal data
- Socio-economic vs. ecological data
Graphic: How to go about finding data:

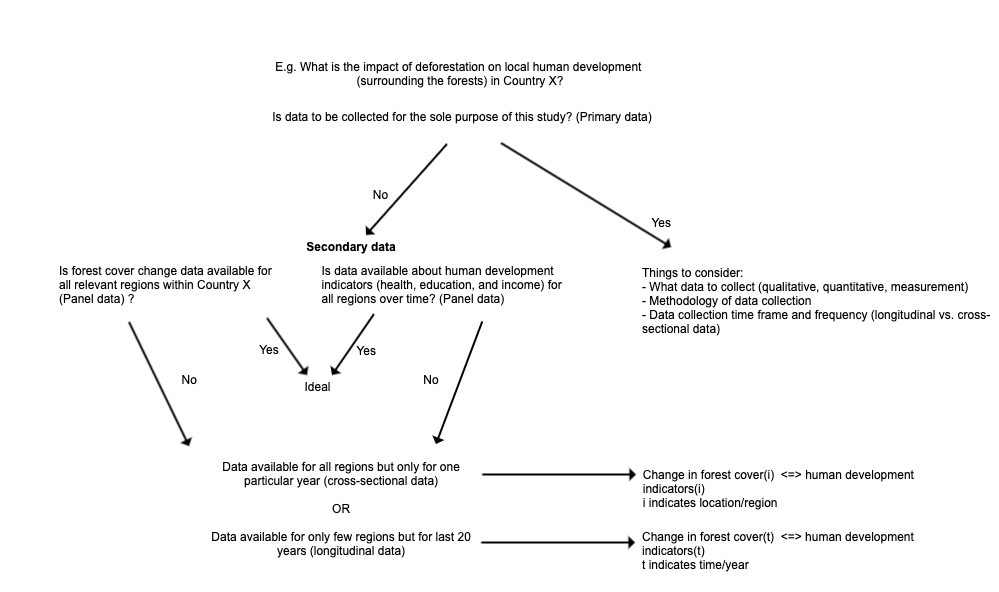
Data Sources:
The internet is full of data, but we have curated here a list of key datasets that we know contain reliable information. We recommend these for your projects, and this is a great place to begin searching for information even if you do end up using other data sources down the road.
| Type of data | Names of data sources |
|---|---|
| Socio-economic data | DHS (Explainer) |
| Climate data | WorldClim (Explainer) |
| Land use data | Hansen Global Forest Change (Explainer) |
| Species Occurrence | Global Biodiversity Information Facility (Explainer) |
Below are an additional list of websites where you can go to find other datasets if need be as well as some GIS layers that could be very helpful in your analyses (for example: roads and cities/towns layer which you could use in spatial analysis). This list is not exhaustive but may prove useful.
| Name | Short Description |
|---|---|
| Google Earth Engine | A cloud-based catalog of planetary satellite imagery and geo-spatial datasets which also allows you to carry out geo-processing on its online platform. (Powerful tool, but a steep learning curve). |
| Free GIS Data | A respository of free GIS data. Note: this repository does not proof or verify the data linked to. It is up to the individual user to decide the reliability and reputability of the dataset. |
| ICSPR (U of Michigan) | A repository of mostly freely available data with a user-friendly search platform put forward by the University of Michigan. |
| Data Verse (Harvard) | A repository of freely available data hosted by Harvard University. Anyone can also add their data to the site's repository for others to use. |
| GADM | Global administrative boundaries, available for every country at all levels of subdivision. High spatial res, many attributes. |
| DIVA - GIS | GIS layers for roads, population settlements, and more are available here - downloadable by country. |
| Copernicus Global Land Service | Land cover maps available at 100m spatial resolution. |
| Intact Forest Landscapes | Spatial data (kml, shp) of intact forest landscapes for the years 2000, 2013, and 2016. |
| Data Planet | Collection of datasets from government, commercial and private organizations. Covers a huge range of topics, including agriculture, natural resources, demographics, etc. Log in through UBC using your CWL. |
| Global Ecology Lab | Various datasets and software, such as mangroves, tidal flats and saltmarsh ecosystem (amongst others). |
| IFAD | Specialized agency of the UN that aims to support rural populations. Contains a variety of data, including impact assessments and some household-level survey data. |
| Tropical Moist Forest | Provides maps and time-series data on tropical moist forest cover and change (deforestation, degradation, regrowth) across tropical moist forests from 1990-2024. |
Keep in mind for all datasets
Though each dataset is different, in general, the following are good practices to avoid some common problems:
- Register for an account. Many datasets require accounts to download the actual data. It can be misleading, as sometimes you can freely download summaries and country briefs. While these are great to look at and get a good overview of the data available, they are not a substitute for when you really need to have the actual data. Many data sources also require you to request permission to download and use it, and the request needs to be approved by the authorizing body which can take a couple of days. Request your data early to avoid last-minute "data panic".
- For socioeconomic data: look at the codebook and questionnaire for your dataset of interest. It is very important that you understand the question that was asked to get the data you are interested in. By looking at how they obtained the data and what exactly the variable codes mean, you can be sure that the data you are looking at holds the information that you would like to know. In some datasets, the codes are extensive and not clear, so the codebook is the answer. It can also give you a good quick overview of the variables that are available.
- For ecological/spatial data: pay attention to the metadata. Metadata is data about data, so it would give you information such as the spatial resolution of the imagery, the year it was taken, what land cover classes are available, etc...
Analyzing Data
For CONS452, we will be using R for all statistical analysis.
RStudio is pre-installed on all the desktop systems in the lab. For your personal computers, please download it here.
R can perform all functions available in Microsoft Excel (and more!).
Detailed help/guidelines on R for this course are available on the R Wiki page here.