Course:CPSC522/User-Adaptive Information Visualization
Principal Author: Yaashaar Hadadian
Abstract
The main goal of designing visual adaptive systems is to support users based on their personal traits and characteristics and also based on the tasks they intend to. Designing visual adaptive systems are studied in the field of User-Adaptive Information Visualization (U-AIV) which includes three key decisions: 1) what, 2) when, and 3) how to adapt (WWH) for designers of such systems. In this page we review two research studies that were conducted regarding the third decision of how to adapt. First one [1] investigates the effectiveness of four different highlighting approaches of a visualization's relevant area based on task complexity, delivery time and user characteristics. Second one [2] investigates the effectiveness of two different forms of presenting feedback to students based on their affective states. The contribution of second study can be seen as adapting WWH framework, and then attempting to investigate further approaches of delivering adaptive supports in order to expand the body of literature in this regard (how-to-adapt branch).
Builds on
User adaptive visualization is studied in the intersection area of three fields of Human Computer Interaction, Information Visualization, and Machine Learning.
Related Pages
Predicting Affect of User's Interaction with an Intelligent Tutoring System can be seen as an attempt to infer the affective states that are discussed in the second study (Feedback), that I describe in this page. General Linear Model (GLM) is an ANOVA procedure incorporates a least squares regression technique to explain the statistical relationship between some predictors such as factors and/or covariates and a continuous response variable.
GLM repeated measure as a statistical technique is commonly used in the experiments that include intervention such as the two described in this page, measuring the effect of a treatment at different time points. It takes a dependent, or criterion variable, measured as correlated, non-independent data. it tests the main effects within and between the subjects, interaction effects between factors, covariate effects and effects of interactions between covariates and between subject factors.
Introduction
The field of Information Visualization (InfoVis) used to comprise of a one-size-fits-all approach, in which, end-user differences were not taken into consideration [3]. However, in recent years, a series of important questions were evolved such as, what if we look at a visualization as an intelligent agent that can play an active role in the environment, that is able to reflect to feedbacks of its actions and improve itself? In other words, what if we make it to be able to adapt to the specific features of environment including characteristics of end-users, it is interacting with, in order to let it tune itself and enhance its effectiveness?
The attempts to answer this kind of questions, formalized a group research work: User-Adaptive Information Visualization (U-AIV) and also justified its association with Artificial Intelligence (AI).
As it is pointed out in the first study that we review in this work [1], we define and categorize research studies in U-AIV as attempts to address all, or a part of any of the following three questions:
- What to adapt?
- What user distinctions (i.e personal, cognitive, interactional, task differences, etc.) should be targeted to adapt to?
- When to adapt?
- What is the best time during the interaction to adapt, in order to maximize the effectiveness?
- How to adapt?
- What strategy should we take in order to adapt to user distinctions?
AI In U-AIV
Machine Learning (ML) models (e.g., classifiers) are the core elements of user adaptive systems, and ML is categorized under AI. In the process of designing every U-AIV system, there is a user or task modeling phase, in which, the characteristics or features (What to adapt) that based upon which, adaptation should take place are modeled. These models are exploited later by the adaptive system to select the best support to present (How to adapt) and the best time to present those (When to adapt) for the maximum effectiveness. In the first study that is discussed later in this page, the four highlighting interventions, and in the second study, the two types of feedback should be based upon aforementioned models. Although in both of these studies, it has been assumed that we are provided with the model and the attempts were made to select the best criteria and values upon which to provide the adaptive support.
The other AI’s direct techniques and artifacts such as sequence planning models (HMM, Max Entropy Markov Model, etc.) come useful when advanced problems of U-AIV are investigated such as sequential presentation of adaptive support in a course of a process. However, as the main goal of this page was to introduce the field by two papers from two different research teams, I decided to select a set of two papers, that present a smooth introduction to the type of problems that are investigated in U-AIV. Without exposure to the following fundamental perceptions, discussing the advanced problems would not seem to be reasonable.
Related Work
To the best of my knowledge, the following studies have been conducted to address the three key decisions of what, when and how to adapt in designing adaptive systems.
What To Adapt
Selecting features to adapt, yields many studies aimed to identify the criteria that have the potential to make differences in users' experience such as their performance , in order to discriminate users based on them:
- Cognitive measures of Perceptual Speed and Spatial Visualization were shown to affect user performance among different visualizations and task types in [4], [5], and [6]
- The personality trait of Locus of Control was shown and regarded as a potential feature to adapt to in [7], [8]
- Cognitive abilities of Visual Working Memory, Verbal Working Memory, and Visualization Expertise were shown in [5] as important adaptation features.
When To Adapt
The best time of delivering adaptations to overweight their potential interruptions is mainly investigated in two major fields of Intelligent Tutoring [9] and Availability Management Systems [10]. However, the following studies were carried out with the similar objective in Information Visualization:
- An approach to infer the need for intervention by real-time monitoring user behavior was presented in [11]
- A user study designed to capture the confusion moments of users during visualization was described in [12]
How To Adapt
Strategies for designing an adaptive system have been mainly pursued between two polarities of suggesting alternative visualizations in one side, and improving the current visualization on the other side, based on user differences, in order to enhance the experience. The nature of some strategies doesn't let me to classify them with certainty in any of these sides, therefore, the following classification is based on their tendencies.
Recommending Alternative Visualization:
- A work in which the system recommends distinct representation such as a pie chart, plot chart, bar chart, sector graph, Euler's diagram, or table was described in [13]. The adaptive system recommends these representations based on four features (what to adapt): user expertise, user preference, the task's information to be visualized, and representation's semantics.
- An adaptive system designed to improve the accuracy of external representation (ER) selection of users on a range of database query tasks was presented in [14]
- An adaptive system that is able to suggest alternative visualization based on the task that a user intends to do with visualization was introduced in [11]
- A system that dynamically adapts the visualization of the search results according to emerging interests of users was outlined in [15]
Enhancing The Effectiveness of Current Visualization:
- Detection and distraction of notifications were studied based on their motions across some information-rich interfaces in [16]
- Adaptive hints were investigated in an educational game in [17]
- [ Selected ] The effectiveness of four different highlighting interventions on current visualizations (Bar graphs) based on three major categories of features (what to adapt): task complexity, user characteristics, delivery time was investigated in [1].
- [ Selected ] The effectiveness of two different forms of feedback presentation based on users affective states was studied in [2]
Focus
Among all studies that had been conducted during recent years in U-AIV, I selected the last two studies that were outlined in the previous section to describe in this work:
- Highlighting interventions and user differences: informing adaptive information visualization support (2014) [1]
- We refer to it as Highlight study.
- Light-Bulb Moment?: Towards Adaptive Presentation of Feedback based on Students' Affective State (2015) [2]
- We refer to it as Feedback study.
The contribution of the second study was to expand the research work on studying different possible strategies and forms of adaptation (How to adapt). One reason for choosing these two studies is that, the second one is conducted by a completely different team, in a different region of the world (Europe, University of London) to continue the chain of studies conducted by the team of first study (North-America,University of British Columbia). Therefore, the second study may consider as a good example of a contribution.
In the following sections, I briefly describe the Highlight study first, and then I review the Feedback study in detail.
Highlight Study
Overview
The first chosen study (Highlight) [1], defined the space of research work regarding U-AIV systems as a series of attempts to address three key decisions of what, when, and how to adapt by user-adaptive system designers. The classification of related work in this page has been performed based on this definition.
The next step in Highlight study was to address the last question (How to adapt) by investigating the relative effectiveness of four highlighting interventions of Bolding, De-Emphasizing, Reference Lines, Connected Arrows which are shown in Figure 1.
Highlighting intervention refers to an attempt or a strategy to enhance the effectiveness of the information visualization that a user is currently viewing. Subsequently, above highlighting interventions were designed to help users in the processing of different visualization by highlighting relevant elements for performing the objective tasks.

The effectiveness of these highlighting interventions was investigated based on two main criteria. First, the task complexity which is comprised of a Retrieve Value (RV) task: "Given a set of specific cases, find the attribute of those cases" [18], and a Computed Derived Value (CDV) task: "Given a set of data cases, compute the aggregate numeric representation of those data cases" [18] as a simple and a complex visualization task. Second, the delivery time which is comprised of delivering interventions at the beginning () or at the time during the course of visualization processing ().
The result was also further discriminated based on the important factor of user characteristics which include:
- Visual Working Memory (VisWM) : A measure of storage and manipulation capacity of visual and spatial information
- Verbal Working Memory (VerbWM) : A measure of storage and manipulation capacity of verbal information
- Perceptual Speed (PS) : A measure of speed in performing simple visual task
- Locus of Control (LC) : A measure of the degree to which one would perceive outcomes as either the result of his/her own behavior, or from some imposed external forces
- Visualization Expertise (VisExp) : A measure of having prior experience of working with simple or complex visualization
Research Questions
The initial research questions in this study were:
- Can highlighting interventions improve information visualization processing?
- Is there an intervention that is the most effective?
- Are questions 1 and 2 above affected by individual user characteristics, by task complexity, and by when the interventions are delivered?
Research Procedure

The experiment was a within subject study, it was taken place over 62 recruited subjects, ranging in age from 18 to 42. They were comprised of 55 students and 7 non-students and they had selected from diverse backgrounds. Before the experiment began, they completed a series of standard computerized tests for the purpose of user characteristics measurement (Table 1). In the course of the experiment, participants were asked to do a set of RV and CV tasks designed to be done using bar graphs (Figure 2). After the experiment, they also took a post questionnaire asking for their evaluation of each intervention's usefulness, along with their relative preferences. Ultimately, General Linear Model (GLM)-repeated-measures was used for user performance analysis.

Findings
The result of this study indicates that in terms of both a user's performance (Figure 3) and user's perceived usefulness (Figure 4), all of tested highlighting interventions are effective in comparison to receiving no interventions, except for the average Reference Lines.. These can enhance a user's visualization processing experience (Question 1).


No individual highlighting intervention was found to be the most effective one. De-emphasizing always the absolute best when it was provided from beginning (, Figure 6) and only on simple type (RV) tasks (Figure 5) (Question 2).

Dynamic delivering of interventions (at time ) did not neutralize their effectiveness in comparison to no interventions (Figure 6), which denotes that, their benefits outweigh their possible intrusiveness (Question 3). This finding implies that further research can be conducted to find the optimal .

Task complexity significantly impacts user performance based on cognitive abilities of VerbWM, VisWm, and PS (The higher, the better) (Question 3). However, this study failed to find a similar result based on user characteristics of LC and VisExp (Question 3). Figure 7 illustrates the relation of VerbWM,PS with task types. A similar trend obtains for VisWm and task types.

Conclusion
The findings of this study reaffirm and emphasize that, the participants with low-cognitive measures can benefit the most from support of adaptive interventions. Highlighting interventions can be very useful in cases in which, a variety of inferences from a set of visualized data sets are required, as users can concentrate on the most relevant parts of the graphs.
This study were carefully and intelligently designed; it tested the most promising highlighting interventions based on meticulous literature review, and conducted a highly controlled experiment. This study focused on bar graphs and well justified its decision by outlining bar graphs' generality aspects.
Nevertheless, it seems that, some weak procedure was followed for testing interventions based on the delivering time, which is prone to many conceptual and computational errors. Researchers have outlined that due to not having a criterion for deciding when to present interventions in dynamic delivering part, they decided to present it once the user had a chance to look at both bar graph and the related task questions. Moreover, the set of tasks was limited in terms of diversity; for instance, all were involved comparing something to the average of a group of data points. Therefore, they may not be representative of common visual analytical tasks. Future development can certainly investigate these matters further.
In the following section, we will see how another team adapted the framework of what, when, and how to adapt, and contributed to expand the body of literatures in the how-to-adapt branch of designing user adaptive systems.
Feedback Study
Overview
The second chosen study (Feedback) [2], followed the space framework of three key decisions defined by the first study (Highlight) [1], and then contributed by investigating the effectiveness of two different presentation types of feedback based on student's affective state while they were carrying out a fix set of tasks in an exploratory learning environment.
According to Perkrun [19], Affective States (also referred to as Achievement Emotions) arise in a learning situation. They are associated with learning instruction, and achievement.
This study argues the vital role of affective states in a student's learning process; positive ones such as awe, satisfaction, or curiosity can lead to constructive learning and negative ones such as frustration, or disillusionment has the potential to inhibit learning.
The researchers were curious to know whether the presentation way of feedbacks should tune according to students affective states in order to support affect change in instances that affect is negative.
Specifically the effectiveness of the following two forms of presentation was studied:
- High-interruptive pop-up window (Figure 8)
- Low-interruptive light-bulb glow (Figure 9)


Also the following 5 affective states were targeted in this investigation:
- Enjoyment
- Surprise
- Frustration
- Boredom
- Confusion
The first five affective states mentioned above, were selected as a subset of affective states that were previously identified in a research study by Pekrun [20], also the last one was selected, as it was previously shown in a study[21] to be significant in the learning process.
The ultimate goal of this study was to produce guidelines for adaptive feedback presentation (presenting feedback in one of the above mentioned fashions) when students are interacting with a learning environment, based on their affective states.
In the following sections I describe this study in more depth and I outline its interesting findings.
Questions
Researchers were interested in two major questions:
- Is there an effect of different presentations of feedback on a student's affective state?
- Does a student's (final) perception of the learning environment and presented feedback differ, according to whether low or high- interruptive feedback is provided?
Design
To address the above questions, researchers conducted an ecological valid Wizard-of-Oz study. Ecological valid studies are those in which, setup and settings approximate the real-world situations. Furthermore Wizard-of-Oz is a type of research experiment in the field of [Human-Computer Interaction (HCI), in which subjects believe to interact with an autonomous computer system, but in fact, it is fully or partially operated by an unseen human being.
Participants
17 students, all in fifth year, ranging from 9 to 10-year old were participated in this study. The sessions took place in a typical classroom with multiple computers where other students were working with the learning platform (Not Wizarded) to make the study ecological valid.
Procedure
- Participants were randomly divided in two groups: 8 students in the high- and 9 students in the low-interruptive feedback group
- They were provided with a fixed sequence of tasks within an exploratory learning environment in which they could learn fractions.
- Different types of feedback were delivered by the wizard based on student's speech and performance. Table 2 shows some types of these feedbacks
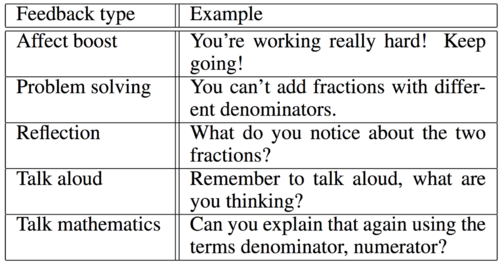
Table 2. Examples of feedback types [2] - Each session lasted on average about 15 minutes
- Participants in the low-interruptive group were able to ignore the feedback provided, by not clicking on the highlighted light bulb. In contrast, participants in the high-interruptive group had to dismiss the pop-up window before they could proceed with the task
- At the end, participants completed a post-questionnaire with 7 questions targeted to learn their thoughts about the learning environment, especially the feedback, and if they found it interruptive
- A smiley face scale [22] was used and scored 1 through 5 (Figure 10)


Annotation
In the course of post-procedure, researchers annotated affective states before and after the feedback was provided. The recorded voice of students and the recorded video of screen display were analyzed independently by two researchers for this task. When two sets of annotations differed in some parts, those parts were re-analyzed and agreed upon between researchers.
They defined affective states in the annotation process as follows :
- ENJOYMENT: Engagement with the learning task. Statements like "This is fun"
- SURPRISE: Gasping. Statements like "Huh?" or "Oh, no!"
- CONFUSION: Failing to perform a particular task. Statements such as "I'm confused!" or "Why didn't it work?"
- FRUSTRATION: Tendency to give up, repeatedly clicking on objects in the learning platform or repeatedly failing to perform a particular task, sighing, statements such as, "What's going on?!".
- BOREDOM: Statements such as "Can we do something else?" or "This is boring".
Analysis
As the data were categorical, they incorporated Chi-Square tests to investigate if there were statistically significant differences between the groups.
Students' affective states before and after feedback was given are illustrated in Figure 11 and are distinguished based on the two distinct groups. As Figure 10 implies, only three affective states of enjoyment, confusion, and frustration were identified in the course of this study. Researchers argued that the absence of the affective state of boredom could be due to the session's short time (15 minutes). They also believed that absence of the affective state of surprise could be associated with possible brief experience of surprise that they missed in the annotation process.
Analysis of post-questionnaires in this study was performed by applying Mann-Whitney test, which reported no significant differences between the two groups (Table 3).
Findings
The findings of this study can be presented in terms of addressing the two initial research questions:
The effect of different forms of feedback presentation on students' affective states (Q1)
The findings showed (Figure 11) that, in order to improve the learning process:
- When students are enjoying the task, both high- and low-interruptive feedback is effective
- When students are confused, high-interruptive feedback should be delivered
- When students are frustrated, high-interruptive feedback should be presented, otherwise, it is very likely that they ignore the feedback

Student's perception of the learning environment, including feedback (Q2)
The results of post-assessment are presented in Table 3 :

- No significant differences between groups were identified
- The researchers mentioned that the slightly better experience among the low interruptive group in the question 2 and question 6 of the post-questionnaire can be associated with the finding of a past research [23] which indicates that students rather to be able to decide themselves, when to receive help than being imposed by interruptive feedback.
The researchers concluded the study by presenting their plan for future work: development of an intelligent feedback system for learning environments to automatically select the best presentation of feedback (low- or high-interruptive) and also choose the best type of it (e.g. Problem solving support, reflective prompts, affect boosts, etc.) based on the affective states of students.
Conclusion
The findings of Feedback study are significant as we can enhance the affective state of a student by delivering a proper type of feedback (Figure 11), and subsequently improve the student's learning process. The findings emphasize the important role of feedback presentation when students are confused or frustrated.
On the other hand, one might ask how we should detect the affective state of the students automatically in the first place to be able to tailor feedback representation based upon? Unfortunately, nothing in this regard was mentioned and it seems that researchers completely forgot to address this matter or refer curious readers to studies Predicting Affect of User's Interaction with an Intelligent Tutoring System, in which, this type of users' traits were shown to be elicited from Eye-gaze data. Another concern about this study is the fact that its subjects may not well represent the community of students as they were all in fifth grade. Therefore, although the idea behind this work can inspire researchers performing more investigations, I believe the finding can hardly be generalized.
Annotated Bibliography
- ↑ 1.00 1.01 1.02 1.03 1.04 1.05 1.06 1.07 1.08 1.09 1.10 1.11 1.12 1.13 G. Carenini, C. Conati, E. Hoque, B. Steichen, D. Toker, and J. Enns, “Highlighting interventions and user differences: informing adaptive information visualization support,” in Proceedings of the SIGCHI Conference on Human Factors in Computing Systems. ACM, 2014, pp. 1835–1844.
- ↑ 2.00 2.01 2.02 2.03 2.04 2.05 2.06 2.07 2.08 2.09 B. Grawemeyer, W. Holmes, S. Guti ́errez-Santos, A. Hansen, K. Loibl, and M. Mavrikis, “Light-bulb moment?: Towards adaptive presentation of feedback based on students’ affective state,” in Proceedings of the 20th International Conference on Intelligent User Interfaces. ACM, 2015, pp. 400–404.
- ↑ C. Conati, G. Carenini, D. Toker, and S. Lall ́e, “Towards user-adaptive information visualization.” in AAAI, 2015, pp. 4100–4106.
- ↑ C. Conati and H. Maclaren, “Exploring the role of individual differences in information visualization,” in Proceedings of the working conference on Advanced visual interfaces. ACM, 2008, pp. 199–206.
- ↑ 5.0 5.1 D. Toker, C. Conati, G. Carenini, and M. Haraty, “Towards adaptive information visualization: on the influence of user characteristics,” in User Modeling, Adaptation, and Personalization. Springer, 2012, pp. 274–285.
- ↑ M. C. Velez, D. Silver, and M. Tremaine, “Understanding visualization through spatial ability differ- ences,” in Visualization, 2005. VIS 05. IEEE. IEEE, 2005, pp. 511–518.
- ↑ T. M. Green and B. Fisher, “Towards the personal equation of interaction: The impact of personality factors on visual analytics interface interaction,” in Visual Analytics Science and Technology (VAST), 2010 IEEE Symposium on. IEEE, 2010, pp. 203–210.
- ↑ C. Ziemkiewicz, R. J. Crouser, A. R. Yauilla, S. L. Su, W. Ribarsky, and R. Chang, “How locus of control influences compatibility with visualization style,” in Visual Analytics Science and Technology (VAST), 2011 IEEE Conference on. IEEE, 2011, pp. 81–90.
- ↑ B. P. Woolf, Building intelligent interactive tutors: Student-centered strategies for revolutionizing e- learning. Morgan Kaufmann, 2010.
- ↑ A. Jameson, “Adaptive interfaces and agents,” Human-Computer Interaction: Design Issues, Solutions, and Applications, vol. 105, 2009.
- ↑ 11.0 11.1 D. Gotz and Z. Wen, “Behavior-driven visualization recommendation,” in Proceedings of the 14th international conference on Intelligent user interfaces. ACM, 2009, pp. 315–324.
- ↑ C. Conati, E. Hoque, D. Toker, and B. Steichen, “When to adapt: Detecting user’s confusion during visualization processing.” in UMAP Workshops, 2013.
- ↑ B. Grawemeyer and R. Cox, “Graphical data displays and database queries: Helping users select the right display for the task,” in Smart Graphics. Springer, 2005, pp. 53–64.
- ↑ B. Grawemeyer, “Evaluation of erst–an external representation selection tutor,” in Diagrammatic Representation and Inference. Springer, 2006, pp. 154–167.
- ↑ J.-w. Ahn and P. Brusilovsky, “Adaptive visualization for exploratory information retrieval,” Informa- tion Processing & Management, vol. 49, no. 5, pp. 1139–1164, 2013.
- ↑ L. Bartram, C. Ware, and T. Calvert, “Moticons:: detection, distraction and task,” International Journal of Human-Computer Studies, vol. 58, no. 5, pp. 515–545, 2003.
- ↑ M. Muir and C. Conati, “An analysis of attention to student–adaptive hints in an educational game,” in Intelligent Tutoring Systems. Springer, 2012, pp. 112–122.
- ↑ 18.0 18.1 R. Amar, J. Eagan, and J. Stasko, “Low-level components of analytic activity in information visualization,” in Information Visualization, 2005. INFOVIS 2005. IEEE Symposium on. IEEE, 2005, pp. 111–117.
- ↑ B. Woolf, W. Burleson, I. Arroyo, T. Dragon, D. Cooper, and R. Picard, “Affect-aware tutors: recognising and responding to student affect,” International Journal of Learning Technology, vol. 4, no. 3-4, pp. 129–164, 2009.
- ↑ R. Pekrun, “The control-value theory of achievement emotions: Assumptions, corollaries, and implica- tions for educational research and practice,” Educational psychology review, vol. 18, no. 4, pp. 315–341, 2006.
- ↑ K. Porayska-Pomsta, M. Mavrikis, and H. Pain, “Diagnosing and acting on student affect: the tutor?s perspective,” User Modeling and User-Adapted Interaction, vol. 18, no. 1, pp. 125–173, 2008.
- ↑ J. C. Read, S. MacFarlane, and C. Casey, “Endurability, engagement and expectations: Measuring children’s fun,” in Interaction design and children, vol. 2. Shaker Publishing Eindhoven, 2002, pp. 1–23.
- ↑ M. Mavrikis, S. Gutierrez-Santos, E. Geraniou, and R. Noss, “Design requirements, student perception indicators and validation metrics for intelligent exploratory learning environments,” Personal and ubiquitous computing, vol. 17, no. 8, pp. 1605–1620, 2013.
|
|