Course:CPSC522/Evaluation of ACO
Evaluating Ant Colony Optimization in a simulation
Principal Author: Kumseok Jung
Collaborators:
Abstract
Di Caro and Dorigo[1] introduced a network routing protocol named AntNet, inspired by the swarm intelligence seen in an ant colony. Dhillon and Van Mieghem[2] have assessed the behaviour of AntNet under varying values of the hyperparamters involved, such as the ant generation interval, link density, observation window size, and few other configurable parameters. They have demonstrated that AntNet is robust under varying traffic conditions and performs comparably to Dijkstra's Shortest Path Algorithm. However, the scalability of the algorithm is not evaluated in either of the papers[1][2], since they only experiment with network sizes of 25 and 50 nodes. In this page we present a graphical ACO (Ant Colony Optimization) Simulator, in the form of a web-application to be viewed on a browser, and use the simulator to observe the behaviour of the AntNet algorithm in varying network sizes.
Builds on
- Swarm Intelligence is a form of collective intelligence that emerges as a result of a group of natural or artificial agents interacting with each other and the environment.
- Ant Colony Optimization is a population-based metaheuristic that can be used to find approximate solutions to difficult optimization problems.[3]
- AntNet: Distributed stigmergetic control for communications networks[1] discusses the implementation of AntNet, published by Di Caro and Dorigo in 1998.
- Performance analysis of the AntNet algorithm[2], published in 2007 by Dhillon and VanMieghem, provides a comprehensive analysis of the AntNet algorithm.
Content
Motivation
In their 1998 paper, Di Caro and Dorigo presented a network routing protocol named AntNet[1] that takes inspiration from the behaviour of ant colonies searching for a food source. During their expedition, the travelling ants leave traces of pheromone on the paths, which indirectly and asynchronously propagate information about the traversed paths to other ants. In a similar fashion, the AntNet protocol implements "ant packets", which flood the network at regular intervals, collecting statistics and stochastically updating the routing tables on the network nodes. In 2007, Dhillon and Van Mieghem have produced a comprehensive analysis on the behaviour of AntNet algorithm under varying hyperparameters. The key takeaways from the analysis are: the algorithm can find a good solution with few ants, keeping a larger observation window for monitoring trip times helps in adapting to fluctuations in traffic, and using squash functions with gentler slope improves performance by making the reinforcement signals more pronounced.
Hypothesis
In this page, we observe the behaviour of the AntNet algorithm in varying network sizes by using a simulator similar to the one built by Dhillon et al. More precisely, we measure the time taken to find the shortest path as we increase the number of nodes in a network, and aim to establish a relation between the time of convergence and the network size. Although the computational complexity of the problem is NP-hard[2], we predict that the time of convergence will not grow in the same order, but grow linearly or logarithmically since the computation is parallelized.
Implementation
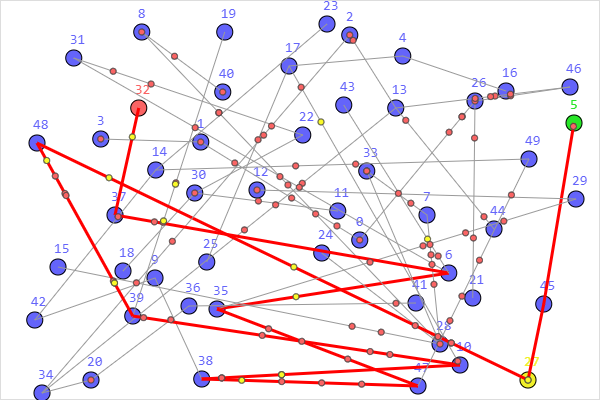
The ACO Simulator implements the AntNet algorithm as described in the original paper[1] and is written in JavaScript. In OOP fashion, there are Ants, Nodes, and a Simulator. The Simulator maintains a set of configurable parameters for running simulations under different conditions; number of Nodes in the network, average link count per Node, Ant speed, Ant generation interval, and exploration probability ε can be configured.
Inside the 2-dimensional simulated environment, the Node positions in the pixel space represent positions in the physical space; the further they are, the longer it takes for an Ant to traverse. When a simulation session begins, Ants are generated from each Node at a defined interval. When the source and destination Nodes are not selected, each Ant arbitrarily picks a destination and begins to explore the network. The forward ants employ the ε-greedy policy with the configured value of ε. Upon defining a source and a destination, all the newly generated Ants search for the destination Node, concurrently updating different routing tables as they traverse the network. To measure the performance of the network, DataAnts are sent out at regular intervals, which greedily travel along the current best path - this is equivalent to ε-greedy with ε=0. The trip times of the DataAnts reflect the performance of the routing protocol (because data packets would be taking the same routes as the DataAnts).
The simulator uses a stripped down version of the "reward" function used for updating the routing tables, and it is simpler than the function presented in the original paper. The reward function introduced by Di Caro et al. is the following:
In the simulator, we use the sigmoid function:
The probabilities in the routing tables are updated as described in the paper:
We use this simpler version of the reward function since we do not consider traffic conditions yet. The second term in the original reward function is a correction term reflecting the stability of the network traffic, and currently in our simulator we only implement a static network without any congestions. Thus, our reward function determines the goodness of a trip time relative to the best record time only. This is a legitimate simplification as Dhillon et al. have shown that the correction term has minimal impact on the performance of the algorithm[2]. In addition to omitting the correction term, we apply a sigmoid logistic function instead of using the original squash function to reduce computation.
Here is a simplified snippet demonstrating how the routing table update is done in JavaScript. The source code is available on Github.
function getReward(elapsed, best){
	var reward = 0.7 / (1 + Math.exp(elapsed - best));
	return reward;
}

Ant.prototype.updateTable = function(node, from_link){
	var self = this;
	var elapsed = 0;
	for (var i = this.memory.length; i < this.memory_persistent.length; i++){
		elapsed += this.memory_persistent[i].arrive - this.memory_persistent[i].leave;
	}

	var stat = node.stats[this.destination.id];
	stat.times.push(elapsed);
	stat.mean = (stat.mean === 0) ? elapsed : (stat.mean + ((elapsed - stat.mean) / 50));	// 50 is the observation window
	stat.variance = stat.variance + ((Math.pow(elapsed - stat.mean, 2) - stat.variance) / 50);
	stat.stdev = Math.sqrt(stat.variance);
	if (stat.times.length > 50) stat.times.shift();
	stat.best = min(stat.times);
	stat.confidence = 1.96 * stat.stdev / Math.sqrt(stat.times.length);		// Z=1.96 for 95% confidence interval

	var reward = getReward(elapsed, stat.best);

	node.links.forEach(function(link, index, body){
		if (link === from_link){
			node.table[self.destination.id][index] = node.table[self.destination.id][index] + ( reward * (1 - node.table[self.destination.id][index]) );
		}
		else {
			node.table[self.destination.id][index] = node.table[self.destination.id][index] - (reward * node.table[self.destination.id][index]);
		}
	})
}
You can also check out the ACO Simulator in the link below:
Experiment
As mentioned above, the current version of the ACO Simulator does not implement traffic congestion. However, it is still possible to evaluate the scalability of the algorithm under static network conditions, since the static network is a special case of a dynamic network - i.e. if the "dynamic" network had constant traffic, it would be equivalent to a static network with the corresponding link weights. In this section, we report the results of running simulations on a static network, with AntNet algorithm configured similarly to unfNet[2], with ε=1.
For varying sizes of the network, we generate a random graph and measure the time it takes to find a path between the source node (index 0) and the destination node (index N-1); this is similar to the method employed by Dhillon et al.. Although the indices of the source and destination nodes are set to 0 and N-1 respectively, we can think of it as picking two nodes at random, as the network itself is randomly generated. Due to time constraints, we have run only 500 simulations for each network size, starting from N=5 to N=1000. A large number of simulations per network size is necessary to obtain a statistically significant result, because the randomly picked source-destination pair can sometimes be close to each other and sometimes far apart. In fact, given a network of 100 Nodes, 500 simulations are not enough to make a meaningful statement, since there are unique permutations of source-destination pairs, or assuming incoming and outgoing links are symmetrical, source-destination combinations. To guarantee that at least one source-destination pair is measured twice, we would need to run 4951 simulations for N=100. With that said, running 500 simulations per network size was enough to observe the correlation between network size and convergence, as the simulations were done in a Monte Carlo fashion.
Discussion

When experimenting with network sizes between N=5 to N=100, it was not clear whether the relation between convergence time and network size is linear or logarithmic. To get a clearer picture, we had to increase the network size further. As it took longer to run simulations in larger networks, we picked the network sizes sparsely up to N=1000. From N=200, the curve in Figure 1 begins to look more logarithmic, and data collected for larger networks further confirm this idea. On the log-log scale, it looks almost linear, suggeting that the relation could be a monomial with a degree between 0 and 1 - i.e .
In the experiment, we assume that the algorithm has converged when it has found a path from source to destination. The trip time experienced by DataAnts exploiting the best routing policy approaches the lower asymptote, suggesting that it has found the shortest path. However, this is an inaccurate assumption as it is possible that a shorter path could be discovered at a later time. We made this assumption because it is very difficult to verify that the found path is actually the shortest out of all the possible paths. In order to prove that a certain path is exactly the optimal solution, the combination of all links must be considered and the computational effort grows exponentially as the number of links in a network increases. This NP-hardness of the problem is the reason we use heuristic techniques in the first place. To see this in perspective, consider the example of a fully-connected network with 5 nodes. Since it is fully-connected, any source node and destination node are connected within 1 link. However, there are 3 paths made up of 2 links, 6 paths made up of 3 links, and another 6 paths made up of 4 links. The table below enumerates all paths between source node (#1) and destination node (#5)

| Index | Path | # of Links |
|---|---|---|
| 1 | 1→5 | 1 |
| 2 | 1→2→5 | 2 |
| 3 | 1→3→5 | 2 |
| 4 | 1→4→5 | 2 |
| 5 | 1→2→3→5 | 3 |
| 6 | 1→2→4→5 | 3 |
| 7 | 1→3→2→5 | 3 |
| 8 | 1→3→4→5 | 3 |
| 9 | 1→4→2→5 | 3 |
| 10 | 1→4→3→5 | 3 |
| 11 | 1→2→3→4→5 | 4 |
| 12 | 1→2→4→3→5 | 4 |
| 13 | 1→3→2→4→5 | 4 |
| 14 | 1→3→4→2→5 | 4 |
| 15 | 1→4→2→3→5 | 4 |
| 16 | 1→4→3→2→5 | 4 |
As we can see, even in a tiny network of just 5 nodes, verifying the correctness of a solution takes significant effort. In a fully-connected network of size , the total number of paths between a given source and destination node is given by and therefore the problem is , which grows faster than but slower than . Real-world networks are usually not fully-connected and therefore are less complex than , but the given example illustrates the difficulty of the problem.
Conclusion
While acknowledging that the AntNet algorithm does not guarantee verifiably optimal solutions, our experiments have shown empirically that it can find near-optimal solutions in reasonable time and its performance does not degrade exponentially as the network size grows. The time needed to find a solution grows logarithmically with the network size, and this is pretty good considering that the complexity of the problem grows exponentially. This makes ACO an attractive and practical option for solving complex combinatorial problems, provided that an approximate solution suffices. However, when trying to find exact solutions, ACO cannot be used as it provides no inherent guarantee of the correctness of a found solution. This heuristic and approximate nature of the AntNet algorithm makes it difficult to debug and formally verify, which may be the reason we do not see this used in practice.
We aim to implement dynamic traffic conditions in future versions of the ACO simulator, and it will be interesting to see if the scalability property holds in a dynamic network.
Annotated Bibliography
- ↑ 1.0 1.1 1.2 1.3 1.4 Di Caro, G. and Dorigo, M., 1998. AntNet: Distributed stigmergetic control for communications networks. Journal of Artificial Intelligence Research, 9, pp.317-365.
- ↑ 2.0 2.1 2.2 2.3 2.4 2.5 Dhillon, S.S. and Van Mieghem, P., 2007. Performance analysis of the AntNet algorithm. Computer Networks, 51(8), pp.2104-2125.
- ↑ M. Dorigo. 2007. Ant Colony Optimization. Scholarpedia.org
|
|