User:PaigeHolloway
Homework 12
Land & Food Systems - Food Nutrition and Health
The field of Nutrition is very broad if we look at it as a whole. I am going to talk specifically about the field of Dietics and disease and illnesses and how calculus is useful in these areas.
All diseases and illnesses begin at a cellular level. In order to understand how to treat symptoms or control illnesses, we need to understand how the disease or illness begins, survives and the trends of the illness.
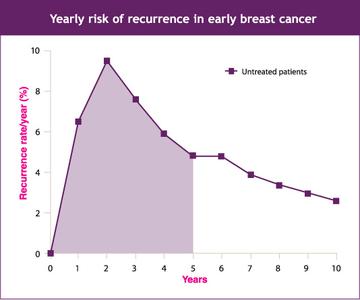
The graph below is an example of how we can see the trend in an illness such as breast cancer. This shows us that through calculus, we can understand how something like cancer can survive in the human body.
In the case of relating calculus to nutrition and disease, I am going to talk about cancer cells. Cancer is something that is known to be treated through chemical treatments, as well as controlling the cancer cells through diet. In order to do so, we come up with a hypothesis, run the experiment, and note trends through graphs. In order to cut back on the amount of work done through an experiment, we can come up with a model to predict what may happen in specific situations.
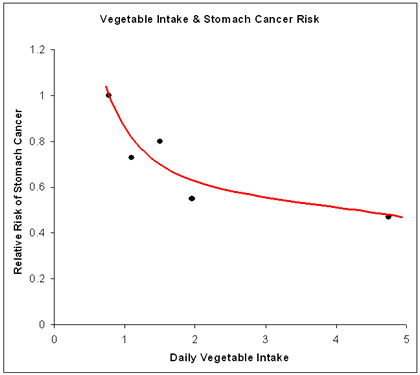
An example of controlling cancer cells through diet, is controlling the pH levels in the body by what we eat. Below is an example of a graph made to show the change in the cancer cells vs. vegetable intake.
This shows us that we can create a variety of models and graphs comparing the rate of cancer cell growth in comparison to a variety of foods. By creating graphs, we can visually see what foods control the cancer, decrease the cancer cells, and what foods encourage cancer cells to grow and multiply.
Once enough research is done towards one specific area of cancer cell control or prevention, we can create and apply a model to that single topic. Because humans come in all shapes and sizes, we can't have the same constants for say the amount in grams of green vegetbales one person should consume. This would need to be in accordance to the person's size, weight, age, and severity of the disease. A model will help us apply our findings to a range of subjects.
In conclusion, using graphs and models to represent cell growth, and death can help us in the field of dietetics determine what types of foods are to be tested on specific types people and diseases. Graphs are an amazing representation of noting trends and making predictions with diseases and illnesses.
HOMEWORK 1
Pythagorean Theorem
Mathematician, Scientist, and mystic, Pythagoras of Samos is best known for the Pythagorean Theorem. The Pythagorean Theorem states that "...in a right-angled triangle the square of the hypotenuse (the side opposite the right angle), c, is equal to the sum of the squares of the other two sides, b and a—that is,"(Wikipedia). The Pythagorean Theorem provides us with a simple way to find the sum of all sides of a right triangle with two given points but only touches the surface on solving all sides of triangles as it only deals with right angled triangle sitations. In order to understand this concept, we can use real life situations to apply the equation to. Amongst mathematicians, we also see people such as carpenters, architects, and kinesiologists using this formula in their professions.
Reference
Wikipedia, http://en.wikipedia.org/wiki/Pythagoras


