Science:Math Exam Resources/Courses/MATH110/December 2012/Question 02 (c)/Solution 1
Remember that a limit describes the y-values of a graph around, but not at the x-value, whereas gives the y-value of a graph at x.
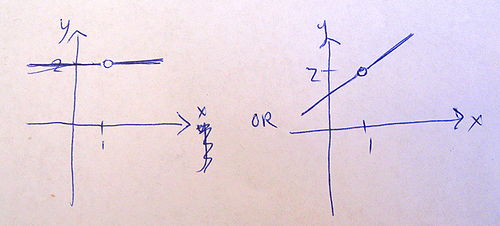
So drawing a picture where (y-values are equal to 2 near x = 1) could look like this:
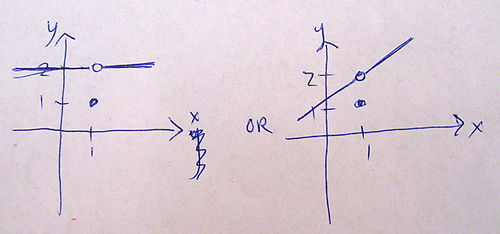
But, , the y-value at x = 1, could be equal to something else, like 1:
Because the conclusion of the statement is not necessarily true, the statement is false.


