Science:Math Exam Resources/Courses/MATH110/December 2012/Question 01 (a)/Solution 2
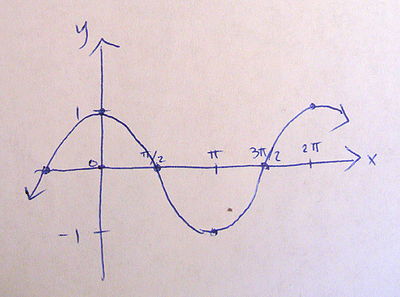
If you've forgotten the rules used in the first solution (or never learned them), you can also use test points. From this picture:
you have the following points, placed in a table of values:
| x-value | y-value |
|---|---|
| 0 | 1 |
| 0 | |
| -1 | |
| 0 |
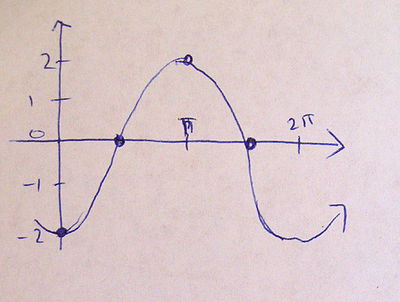
Plugging these same x-values into gives:
| x-value | calculations | y-value |
|---|---|---|
| 0 | -2 | |
| 0 | ||
| 2 | ||
| 0 |
Drawing a picture based on these points, it should be clear that the graph has been shifted right by and expanded vertically by 2.


