Science:Math Exam Resources/Courses/MATH110/April 2013/Question 09 (b)/Solution 1
Appearance
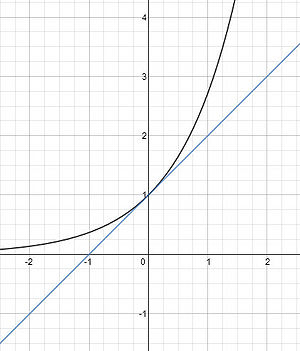
The function is concave up, so all tangent lines, including our linear approximation, will lie below the graph.
The purple graph is f(x), the blue line is the linear approximation L(x) = x+1 from part (a). Thus our linear approximation is an underestimate.

