Science:Math Exam Resources/Courses/MATH110/April 2012/Question 05 (g)/Solution 1
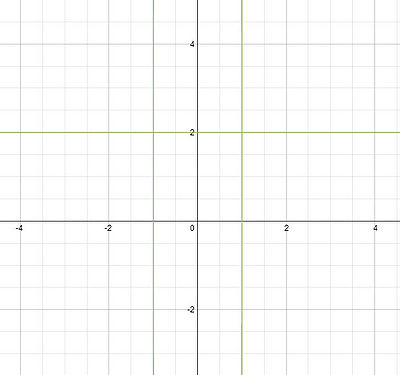
As suggested in the hint, we start by drawing the vertical and horizontal asymptotes. The vertical asymptotes are , and the horizontal asymptote is .
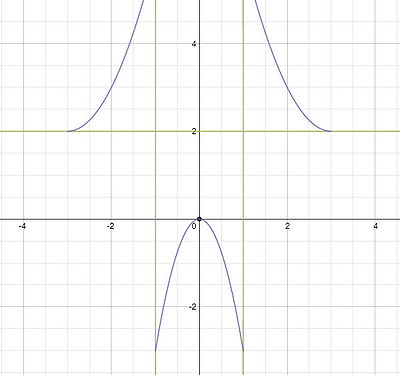
We know that the function increases to the left of , increases again between -1 and 0, and then decreases from 0 to 1, and then again after . Furthermore, the graph must go through the x-axis at the point (0,0) but not anywhere else. This suggests the following picture:
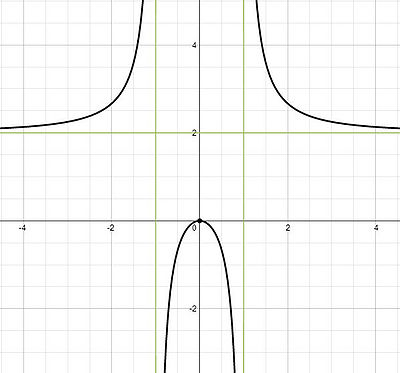
Confirming that this picture matches the concavity found in part ƒ (concave up outside of (-1,1), concave up inside (-1,1)), we we arrive at the final sketch:


