Science:Math Exam Resources/Courses/MATH110/April 2012/Question 02 (b)/Solution 1
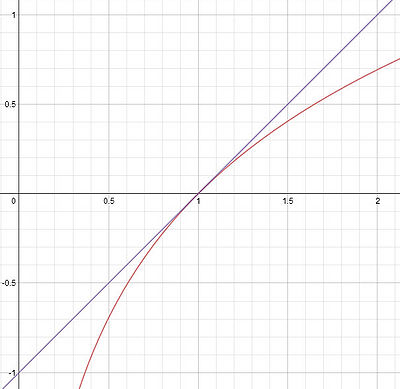
If you draw a picture of and the linear approximation (see below), you can see that the linear approximation is above the graph of . This means that the value of the linear approximation will be greater than the value of the actual function.
Another way of showing this is to prove that is concave down. A concave down function has all of its tangent lines above the graph of the function and so the same conclusion follows as above. We know is concave down because its second derivative is which is always negative.


