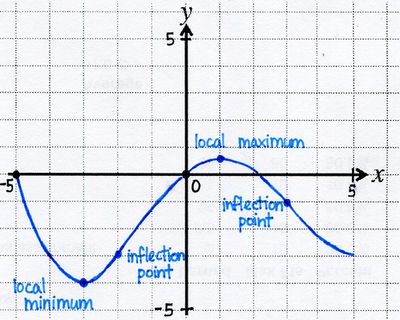
Science:Math Exam Resources/Courses/MATH104/December 2015/Question 03 (c)/Solution 1
Appearance
First, we plot our x-intercepts:
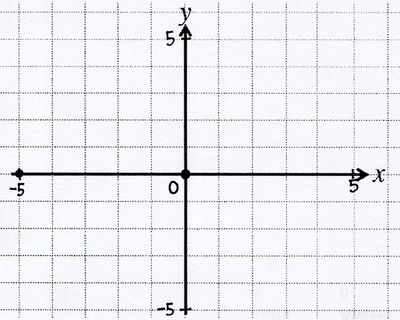
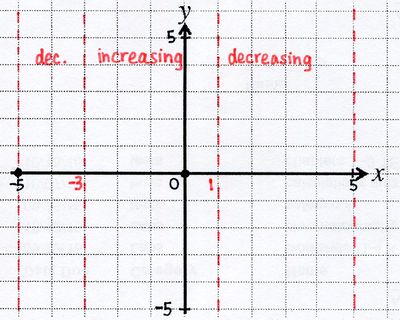
We then identify intervals of increase and decrease (see hint 1):
- for and
- for
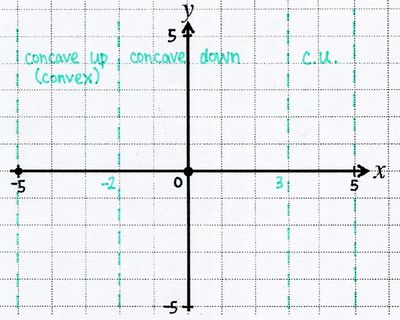
Next, we consider concavity (see hint 2):
- for
- for and
Following these guidelines, we make a rough sketch of a possible function satisfying the above (see hint 3 for a tip):
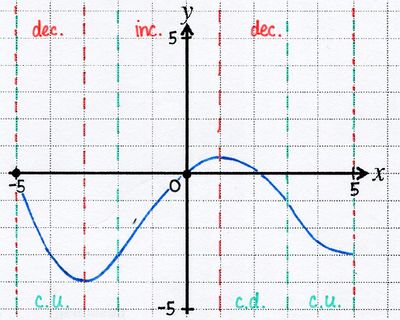
Finally, we label local extrema and inflection points (where changes sign):
