Science:Math Exam Resources/Courses/MATH104/December 2014/Question 05 (f)/Solution 1
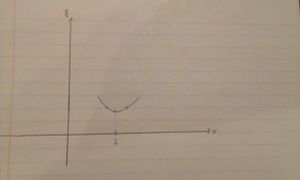
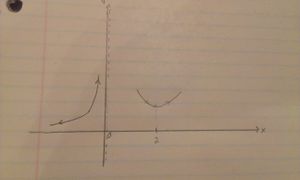
We know from part that the critical point of occurs at ; hence the graph of the function will change from decreasing to the left of to increasing to the right of (see first image below). Next, we know that in the interval to the left of the vertical asymptote at , the function is increasing. Moreover, in that interval, as tends to , tends to . From part , we know that in this interval, the function is concave up (see second image below).
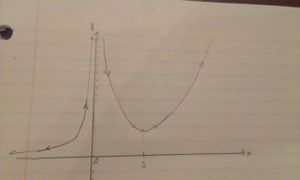
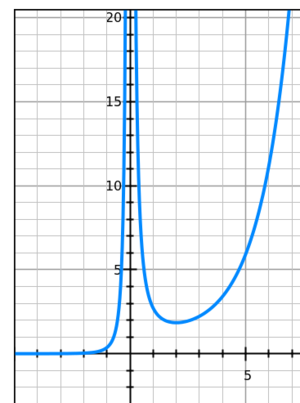
Next, we focus on the intervals to the right of the vertical asymptote. In the interval , we recall that the function is decreasing whilst in the interval , the function is increasing (see third image below). From part , we know that it is concave up in , and flies off to infinity as tends to . Combining these facts we have the graph depicted in the fourth image below:


