Science:Math Exam Resources/Courses/MATH104/December 2011/Question 02 (g)/Solution 1
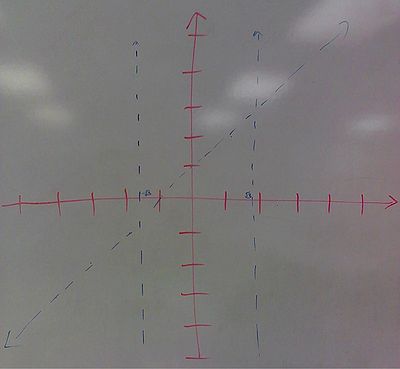
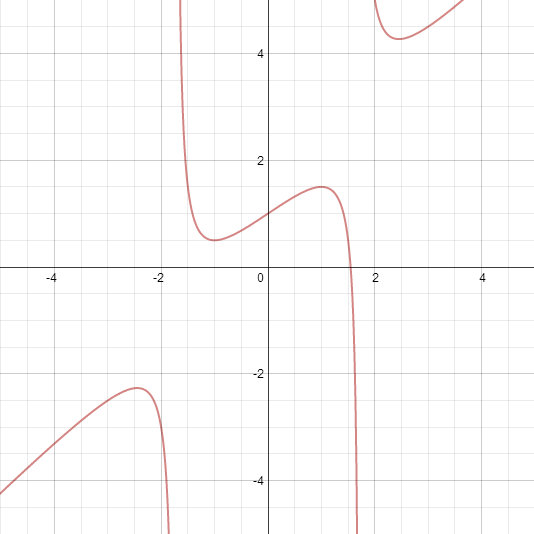
Following the order given in Hint 2, we first draw the asymptotes.
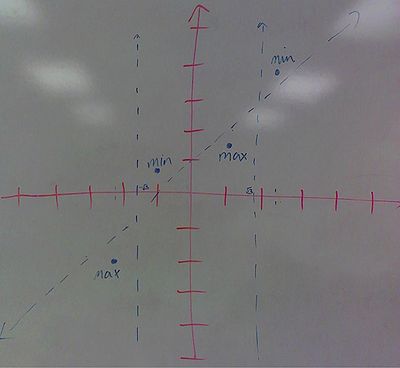
We then draw the maxima and minima.
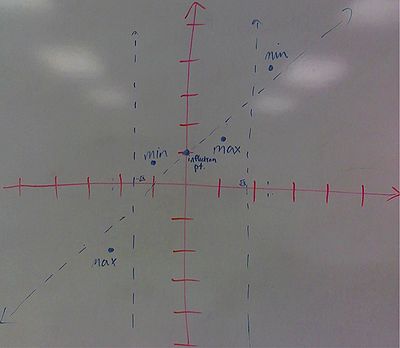
We draw the inflection point.
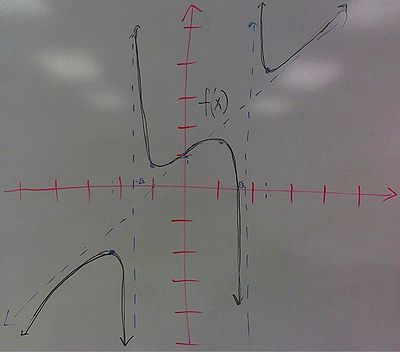
Finally, we use information about where the function is increasing and decreasing, as well as its concavity, to connect these points and finish the graph.
A graphing calculator would produce the following picture:
