Science:Math Exam Resources/Courses/MATH103/April 2012/Question 04 (f)/Solution 1
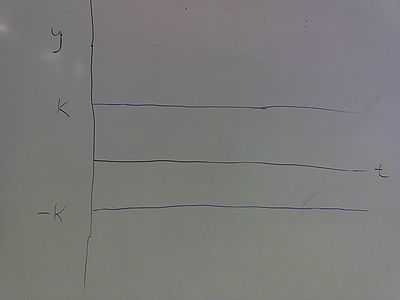
First, we graph the constant solutions to the differential equation: and These are the solutions we got from part a.

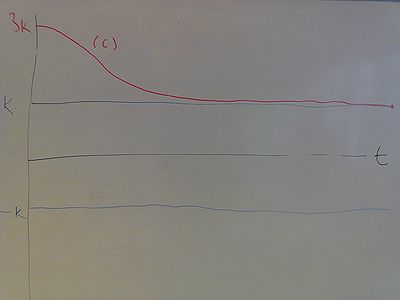
Then, we graph the solution from part (c). Since 3k is larger than the constant solution k, it follows that the graph must stay above this line (since if y = k at any point , then y must be equal to k for all ). Furthermore, if this holds, then y^2 > k^2, so from the differential equation given in the problem statement, is negative and therefore the function is decreasing.
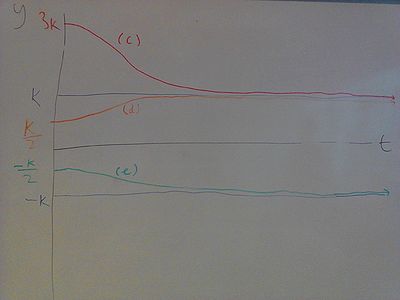
Now, we graph the solutions from part (d) and (e). Since and are between -k and k, it follows that the graphs for each of these solutions must lie between the constant solutions y=-k and y=k. The graph from part d has . Note that for any , dy/dt is positive, so the solution to the differential equation given in (d) should be increasing. We know that the limit of the function as is k. Similarly, if we plug a y-value such that -k < y < 0 into the differential equation, we see that the solution should be decreasing, so the graph of the solution described in part e should decrease to its limit -k.


