Science:Math Exam Resources/Courses/MATH102/December 2015/Question 18 (c)/Solution 1
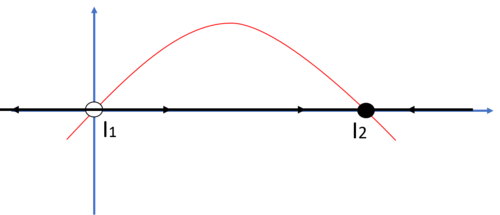
First, draw the graph of the function . (In the figure below, the red line is the graph of )
Note that in the part (a), we find two steady state solutions and . (i.e., )
Then, from the figure, we can easily see that on and , , while on , .
By the hint, this means that on and , is decreasing, so that we have the left arrows in these intervals on the phase line.
On the other hand, on , is increasing and hence we get the right arrow.
Once we draw the arrows, it is obvious that is unstable (make empty hole), while is stable (fill up the hole).
To summarize, we obtain the following phase line:


