We begin by finding the zeroes of the original function,

and since  always, only
  is a root. But we note that
  is always greater or equal to zero.
Next we take the derivative and see that

Finding the roots gives us  . Making a sign chart, we see that
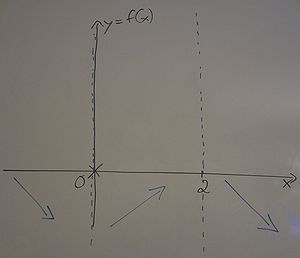
- The function is decreasing between

- The function is increasing between

- The function is decreasing between

Graphically, we have
and thus we have that  is a local minimum and
  is a local maximum. The coordinates are given by
  and
and  (note that
  is roughly
  ).
).
Lastly taking the second derivative, we have that

The zeroes of the second derivative are given by  .
.
Using the quadratic formula gives us the roots

Making a sign chart, we see that
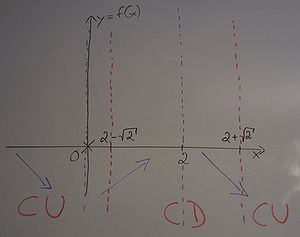
- The function is concave up between

- The function is concave down between

- The function is concave up between

Graphically we have
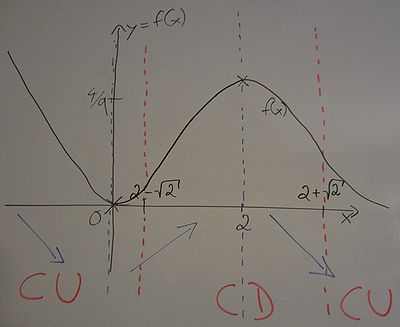
Hence, we have that  are inflection points. Combining all this information, we have the following. First plot all known points of interest and label where the function is increasing, decreasing, concave up and concave down. Then connect the dots in a consistent way. Don't forget that
  was given to us and we can use this information.