Science:Math Exam Resources/Courses/MATH102/December 2012/Question C 04 (c)/Solution 1
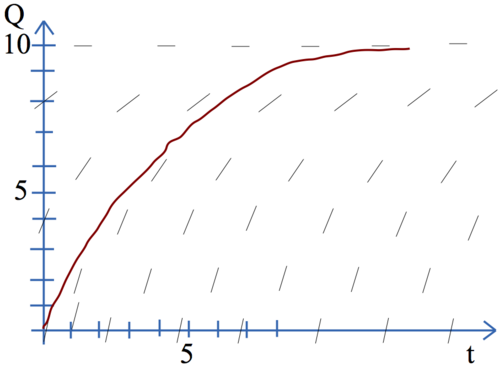
We want to sketch the solution without solving the equation. Hence, we draw the phase space for (the number of leaves) and (the daily rate of change of leaves). Therefore, we first make a table with and the corresponding .
After drawing the phase space, the curve of the solution can be plotted by following the slopes.


