From parts (a), (b), and (c) we know the following about  :
:
- The critical numbers of
 (where
  is zero or does not exist) are
- is increasing on
 and decreasing on
- has a local minimum at
 and a local maximum at
  (note the change in the increase/decrease of )
- is concave up on
 and concave down on
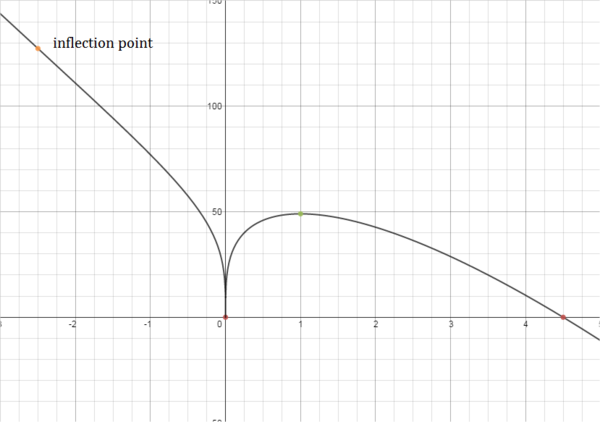
- has an inflection point (changes concavity) at

 and thus has x-intercepts at
 and
and  , thus the graph of is very steep near
Plotting the points of interest gives the following:
Accounting for increase and decrease gives the following rough sketch:
Finally, incorporating concavity leads us to the final graph:

_Step_1.png)
_Step_2.png)
_Step_3.png)