PHYS341/2023/Project10
Finding the Right Bass EQ

Introduction
One of the first questions many of us have when we first see a rock band is, "Why is that guy playing a four-stringed guitar?". Okay maybe not all of us, but I definitely did. I googled the band, I found out that the bassist in a band plays a critical role of maintaining the rhythm of a song and helping the lower frequencies come through.
According to ProSoundHQ (2021), bass guitars usually provide lower frequencies, guitars mid-range frequencies and vocalists provide high-range frequencies: “The balance…helps the band to sound cohesive…[and maintain] overall tone”. The bass guitar, in that perspective, is a very intricate and necessary instrument. As the saying usually goes, you probably don’t recognize it, but you would notice it if it was gone.
A key feature of the bass guitar is that it has to be run through an amplifier to be able to hear the low frequencies that it emits. However, the bass also emits other frequencies like middle frequencies and high frequencies, all of which can be manipulated to reach a desired Equalization (EQ). Each bass amp has a set of EQ knobs that helps modify the low, middle, and high frequencies to suit the music and the room in which one is playing. In this Wiki, I will elaborate more on how bass equalization works and why people have the need to change it, with an additional note on how the sound of a bass through an amp is dependent on the environment in which it is played. I will include time graphs and spectrum graphs at different variations of EQ and analyze how the frequency and timbre changes.
Background
Before diving into this experiment, I would like to give some contextual information about the bass frequencies, why we should care about equalization, and physics of the bass and EQ.
First off, let's talk bass frequencies. Bass frequencies range from low to high and Figure 2 below shows them in the context of other popular instruments. The amount of frequencies one would like to be present can be manipulated through EQ. There are three different factors to equalization: (1) Bass, (2) Mid, and (3) Treble. Each of them have a knob on the amplifier and can adjust the amount of certain frequencies. Here's what you need to know about each of these:
- Bass
- These are low frequencies (range: 60-250 Hz)
- This is one of the main focuses of the bass and bass amplifier
- Caution: too much bass gives a muddy tone
- However, it is important to note that too much bass (low frequencies) will cause the sound to be very heavy sounding and notes will blend together warmly
- Mid
- These are mid-range frequencies and the range is often split into Low-Mids and High-Mids
- Low-Mids (range: 250-1500 Hz)
- High-Mids (range: 1500-4000 Hz)
- This helps distinguish notes, creates depth, and gives clarity to the tone
- Caution: too much mid gives a boxy and hard sound
- This can cause the mid range to overpower the low frequencies, taking up more sonic real estate that guitars usually occupy (and moving away from the bass frequency spectrum)
- These are mid-range frequencies and the range is often split into Low-Mids and High-Mids
- Treble
- These are high frequencies (range: 4000-7000 Hz)
- This is known for creating a brighter and sharper tone
- If the song calls for a bass riff, the treble needs to be high enough that the notes sound distinct
- Caution: too much treble will create a twangy or noisy sound
- Similarly to too much midrange, too much treble will cause the bass to sound less like a bass and overwhelmingly harsh
Bassists agree that some combination of these will help you achieve the EQ you want, whether that be for rock music or blues and every other genre that exists.

So going back to my first question, do we really need bass? You know the answer is yes, but here is the physics behind it. As any acoustic or electric guitar, the bass guitar uses stretched strings to produce sound. The tuning knobs on the guitar help modify the tension within the string which then can alter the frequency, which in turn alters the wavelength and therefore the sound of the string. Each end of the string is secured, one end at the tuning knob and the other at the bridge. These secure ends, nodes, have no displacement and anti-nodes have maximum displacement.
This experiment is not only designed to help aspiring bassists like myself to find the right sound, but also to analyze how the shape of the sound wave changes. The velocity of sound remains mostly constant (assuming that temperature remains the same), but the wave shape, or timbre, varies from instrument to instrument because of the frequencies present. While pure tones have sinusoidal waves, instruments playing chords or EQ manipulations (as we will see) create different wave shapes. This can be attributed to the Principle of Superposition. This principle explains that two waves can travel in the same medium at once and when two sound waves confront each other, they will combine into a sum creating a unique wave shape before continuing on their respective paths. This explains why having different variations of bass, mid, and treble create different timbres, which of course means different sounds! Now on to the experiment where we will put this to the test!
The information for this section came from Ippersiel (2018), ProSoundHQ (2021), Armada (2020), and class lecture materials.
Testing Different Variations of EQ
Procedure

For this experiment, I will be using my Fender Precision (PJ) Squire Bass Guitar (Figure 1) and the Fender Rumble 15 Amplifier (Figure 3). This amplifier is a 15 Watt amplifier with an 8” speaker and three-band EQ. This amplifier has four knobs: left to right (1) Volume, (2) Bass, (3) Mid, and (4) Treble.
My controls for this experiment are as follows:
- My bass tuned to Standard Tuning (EADG) at neutral equalization settings
- The volume set at 25%
- All pick ups at approx. 50%
I recorded all of the individual strings’ frequencies with all the EQ turned all the way down. For ease of experimentation, I only observed how the frequency and timbre changed for the E1 string. I conducted 15 manipulations, and the full rundown of the sequence in which I did the tests can be found in the Appendix section.
To test different variations in EQ, I used Audacity to map spectra, observe timbre, and use the periods to calculate frequency.
To provide an audial aid, I have included some audio files of a bass riff played with different EQ settings. The riff comes from the song Unbothered by Omar Apollo. Each file can be found through the links in the Results section below. If you would like to hear how the sound changes, I have included a file with all of the riffs back to back in the Appendix section.
Results

For purposes of brevity and relevance, I have only included nine of the results from my tests. If you would like to see all the graphs from the experiment, see the Appendix section. However, this range of photographs and analyses will provide enough information to draw some conclusions. Frequency (f) is represented for all of the graphs below in parentheses.
- I recorded the individual E string with no EQ manipulation (see Figure 4). We can see that there is a clearly identified timbre of this wave (there are many tiny waves along the bigger defined wave) and it is somewhat periodic. The frequency of this wave is approximately f = 16.67. Here is an audio file of what this note sounds like on its own:

- Ippersiel (2018) suggests that new bassists should begin with a fully neutral EQ where bass, mid, and treble are all at their 12 o'clock position (see Figure 5). Here's what the time graph looks like (see Figure 6) and the spectrum graph (see Figure 7). The frequency is (f = 118.18) and this is what it sounds in a bass riff:

Now, let's take a look at how the tone sounds when one of the knobs is at its max.
- First we have the bass is cranked all the way up but mid and treble remain neutral (see Figure 8). The amplitude is much higher meaning that the sound was much louder, even though the volume remained constant. (f = 40.40). Audio:
- When the mid is all the way cranked up and bass and treble are neutral we see another change. See Figure 9. (f = 90 Hz). Audio:
.png)

- Finally, I have included what the time graph looks like for only treble, with neutral bass and mid frequencies in Figure 10. Frequency and Audio are as follows: (f = 123.81)
One more variation type to go: two knobs cranked up.
- In Figure 11, we have bass and mid turned to their max while treble remains neutral. Frequency is (f = 129.41) and Audio can be found here
- In Figure 12, we can see how this tone changes when the mid and treble are cranked up while the bass stays neutral. Though this seems contradictory for the bass instrument, ProSoundHQ (2021) assures us that some genres actually do not rely so much on the bass and have the bass at a more neutral place. Frequency and Audio: (f = 77.78),
- And lastly, we have the bass and treble turned all the way up with the mid remaining neutral. In Figure 13 we can see the difference between this EQ and the two other variations. The frequency of this variation is (f = 133.33). Audio file:
- Just for your interest, I also did a test where all of the EQ knobs were set to their max. In Figure 14 you can see both the timbre and the spectrum graph of this combination. The amplitude is high and there are many frequencies present. The sound is very loud and boomy but very full. The frequency is (f = 133.33) and the Audio is as follows:
With all of these time graphs, we can compare how each variation is distinguished from one another because of the group of combined frequencies. Each group of combinations can also be interpreted as a sum of the individual bass, mid, and treble waves.
Discussion
The time graphs I have included above clearly depict how timbre of sound changes with these different frequencies. When we crank up some of the knobs, we can easily notice a huge change in amplitude despite the volume remaining constant. Moreover, for each manipulation we observed a different wave shape, despite minor adjustments to the knobs. A notable feature of this experiment is that the wave shape changed over time. The longer the sound lasted, the more sinusoidal the timbre became. This can be attributed to the dying down of higher harmonics as time went on. This loss of high frequencies can be true for a lot of instruments but it perhaps works in favour of the bass guitar.
My results show that the set of frequencies present in a bass is dependent on the EQ, but that spectral changes are predictable. We know that we will get higher frequencies when we crank the mid or the treble. Yet, low frequencies were always consistent.
Lows are the bass's specialty but spectral graphs from many of the test results yielded peaks in some low frequencies, particularly 81 Hz, 123 Hz, and 165 Hz. This proved true regardless of whether the bass was cranked to the max. Taking our knowledge of physics, this tells us about resonance: the natural resonant frequencies at which the instrument likes to vibrate. Since these frequencies were prominent, we can consider these resonant frequencies.
Personally, I like a fuller and heavier bass sound. However, from doing this experiment I was able to acknowledge that this can create some sense of dissonance: notes tend to blur together as a result of stimulating regions close by (or outside the critical band) of the basilar membrane in the ear's cochlea. Therefore, as Ippersiel (2018) and Armada (2020) caution, we should not be so quick to drastically crank EQ settings because it can cause the tone to sound dull. Instead, as this experiment shows, it is important to consider how sound waves behave and that EQ is all about creating balance!
EQ and Environment
When I did this experiment, I was in a very small room (my bedroom) and it was crowded with many things. Not only were there reflections from the ceiling and the walls, there was also lots of furniture that the sound waves were reflected off of. The bass amplifier was positioned near one of the open walls to reduce reflection of sound off that one wall.
Ippersiel (2018) tells us that the sound of the bass will differ based on the room acoustics because based frequencies are omnidirectional. Once it leaves the source, the sound waves move outward and can be absorbed into an object (energy converted to heat), or it can be reflected off of the object back into the room (energy redirected and still present in the space). Reflection is unideal because it often causes these older, reflected sound waves into bump into newer waves coming from the sound. According to Ippersiel (2018), this creates a "sonic mud" of sound because the waves add up together (via the Principle of Superposition). To prevent this, one can put the amplifier near a wall (not touching so the adjacent wall doesn't vibrate!) and cover the room in sound insulators (such as carpets, blankets, eggshell cartons on walls) which increase absorption.
Ippersiel (2018) also notes that where a bassist stands is important. The rule of thumb is that the size of the speaker in inches is equivalent to how far one should stand in feet (ibid). For example, my bass is 8 inches, so I should be standing 8 feet in front of the amplifier. Though this is not always possible to adhere to, it is definitely ideal to follow this to get the best sound. Finally, Ippersiel (2018) suggests that lifting the bass up by 45 degrees or placing it at a higher spot (like on a chair) can help the sound waves to actually reach your ear (instead of hitting your calves)! Why is this relevant to EQ? It is important to consider the position of both the amplifier and the bassist (holding the bass of course) because the tone of a bass sound is not only a product of the EQ, but also of room acoustics.

Conclusion
Through this experiment we have clearly seen that manipulating the EQ alters not only the frequencies present within the sound, but also the timbre (wave shape) of the sound. Knowing which frequencies are present can help us understand the physics of the bass and how to adjust EQ to get our desired tone. The bass is an essential to so many genres of music and finding the right bass EQ is a process of creating balance. Experts suggest playing around with the knobs (not too drastically!) and let your ear tell you what to hear!
Limitations
As with any study, there are a few limitations to my experiment.
- I did the experiment in my very small bedroom which is crowded with furniture. Though the floors are carpeted, all the walls and ceilings easily reflect sound. Although I do not think that this posed too many issues--especially with the Audacity recordings showing the very first sound waves--it is important to consider.
- I would like to point out that I did my best to pluck the strings with the same force every time but I did not measure and there is no way for me to completely ensure it. Therefore, the amplitudes we see in the time graphs provided in the results section may not be entirely precise. Nonetheless, this experiment and other sources have confirmed that turning up the EQ knobs naturally boosts the sound. Though there is no way to ensure equal force while plucking, high amplitudes on the last six time graphs are predictable.

Ideally, there would be a way to regulate the force applied when plucking and manage the absorption of sound. Aspiring bassists will play larger venues than the size of my bedroom and hopefully will have better acoustics. The 'right' EQ is of course variable, but this experiment shows the physical properties of sound and equalization which helps us get an idea of what the sound waves emitted by the bass amplifier look like in both time and spectral graph visualizations. The changing timbres and spectrums of sound as they relate to changing EQ settings will help us find the frequency range in which we would like to play and translate that practically by modifying EQ.
References
Armada. (2020, August 14). EQ explained - The basics. Armada Music. https://www.armadamusic.com/university/music-production-articles/eq-explained-the-basics
ProSoundHQ. (2021, June 29). Amp settings for bass guitar: A complete guide. Pro Sound HQ. https://prosoundhq.com/amp-settings-for-bass-guitar-a-complete-guide/
Ippersiel, M. (2018, December 1). Bass amp EQ for beginners. Bass Guitar Rocks. https://www.bassguitarrocks.com/bass-amp-eq-for-beginners/
Appendix (for your interest!)
As promised, the complete audio of the bass riff in different EQ variations can be found here:

I was not able to mention the EQ settings before each riff but this is the order:
- Full Neutral
- Full Bass + Neutral Mid and Treble
- Full Mid + Neutral Bass and Treble
- Full Treble + Neutral Bass and Mid
- Full Bass and Mid (+ Neutral Treble)
- Full Bass and Treble (+ Neutral Mid)
- Full Mid and Treble (+ Neutral Bass)

Figure 12: Full Bass and Treble (+ Neutral Mid) - Full Bass, Mid, and Treble

Please note that my laptop microphone was unable to process and record the low volumes of the bass without any EQ which is why I could not include it here.
-
I have also included some other time and spectrum graphs from my experiment. The experiment does not require this but it was interesting to see and understand. Each figure is labelled with the EQ settings and other notable factors.
Here is the full rundown of sequence of the manipulations:
- No EQ
- Neutral Bass
- Neutral Mid
- Neutral Treble
- Neutral Bass and Mid (no treble)
- Neutral Bass and Treble (no mid)
- Neutral Mid and Treble (no bass)
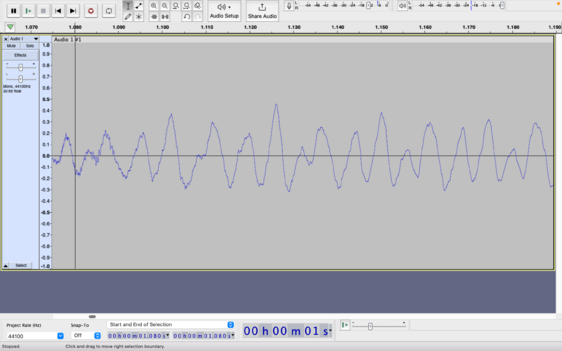
Figure 13: Full Mid and Treble (+ Neutral Bass) - Neutral Bass, Mid, and Treble
- Full Bass + Neutral Mid and Treble
- Full Mid + Neutral Bass and Treble
- Full Treble + Neutral Bass and Mid
- Full Bass and Mid + Neutral Treble
- Full Bass and Treble + Neutral Mid
- Full Mid and Treble + Neutral Bass
- Full Bass, Mid, and Treble
Please note that all the figures are the ones that are not included above and are underlined in this list. You can find them using this file link: File:PHYS 341 - EQ Manipulations.pdf

.png)