Library:HSS GIS What Is GIS
Geographic Information Systems
Geographic Information Systems, or GIS, are computer software programs that capture, store, analyse, query, and display geospatial data. (GIS can also stand for Geographic Information Science, but in this document we are referring to the computer software and data, rather than the academic study of GIS.)
GIS (or Geospatial) Data
GIS data sets can be geometric:
- Points represent locations (like fire stations, schools or cities)
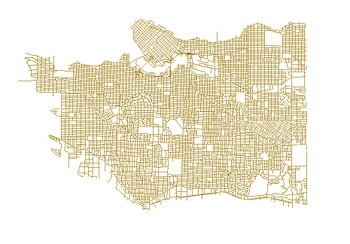
- Lines represent networks (like roads, railroad tracks, power lines, trails)
- Polygons represent areas (like parks, city boundaries, building outlines, census tracts)
(Think of how these things are represented on paper maps.)
These data sets are called vector data sets, or shapefiles (or feature classes within a geodatabase).
Each data set has only one type of geometry, but may have many features.
- A road data set will only have lines (no points or polygons), but may have thousands of lines representing all of the roads in a given area.

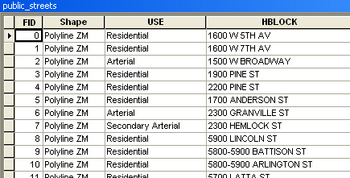
Each feature within a data set has information, or attributes, associated with it.
- Each road segment may include the road's name, highway number, number of lanes, speed limit, or address range, for example.

Data sets can also be rasters:
Rasters are like digital images. They are made up of square cells (pixels) in a grid, similar to a digital photograph.
- Cell values are numbers that represent the dominant characteristic within a cell (like elevation, vegetation type, or temperature).
- A cell value in an elevation raster may equal 1705, meaning that the average elevation within that 30-meter-by-30-meter cell is 1,705 meters above sea level. Colours can then be used to display the cell's number values.

Bringing Data Together
With GIS software, users can overlay multiple data sets for the same geographic area, and examine the spatial relationships between them. These relationships include:
- Size (length, area)
- Distance (between or within features)
- Intersection (where features meet)
- Containment (what features are within another feature, such as what trees (points) are within a park (polygon))
- Adjacency (what features are next to each other, such as what province is next to another)
In order to do this, the software must know the actual locations of the features. In simplified terms, data sets represent the best approximate locations of features on Earth.

The Power of GIS
GIS software is very powerful, and can be used to manipulate GIS data in many ways: geometric features can be moved or reshaped; attributes can be changed; features can be added or deleted. Data sets are DYNAMIC. And hundreds of tools are available to analyse and evaluate the spatial relationships between data sets. We can begin to see new patterns and characteristics of the world around us by viewing the spatial relationships between the earth's features.
The technology is constantly improving and expanding the ways in which we examine the world around us.
For More Information...
More detailed explanations of GIS are available on the following websites:
http://www.esri.com/what-is-gis
http://www.youtube.com/watch?v=oMUGp0rGf7I [YouTube video by Esri]
http://downloads2.esri.com/ESRIpress/images/108/UNDERSTAND_intro1.pdf