Library:HSS GIS Census Data and GIS
This guide will show you how to prepare census data files so that they can be joined to Cartographic Boundary files using Arcmap.
Sources
Census data at the census tract level or larger for 2006 and 2011 are now available for free on the Statistics Canada website: http://www.statcan.gc.ca/
Abacus (UBC Library)
Dissemination area level Census data are available through the UBC Library’s data server.
“Topic-based Tabulations” are tables that have information about:
- Immigration
- Languages
- Marital status
- Labour force activity
- Housing
- Education
- Age and sex
The shapefile “Combined Dissemination Block Digital Cartographic File and Geographic Attribute File, 2011 [2012]” joins dissemination block polygons with information about:
- Population
- Private dwellings
Or, you can search Abacus for other census and survey data tables.
Find Tables
- Log into Abacus with your CWL or library barcode and pin.
- Search for "Topic-based tabulations" in the Search box.
- Ensure the one you choose covers dissemination areas if that is the level of geography you are looking for.
- Download the file, unzip it and open it in Beyond 20/20.
Beyond 20/20
- Beyond 20/20 is free and can be downloaded here.
- It is already installed on all library computers.
As an example, we'll be looking at the following file, from the 2011 Census of Canada Topic-based tabulations. Select the Data & Analysis tab and look for 98-312-XCB2011017.IVT:

This table contains information about the number of children in different types of households.
Prepare
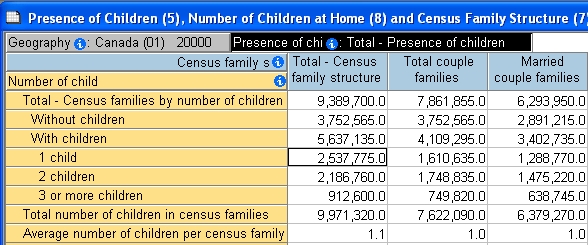
When you open the table in Beyond 20/20, the different colours of the dimension headings tell you what they are doing in the table.
- Yellow dimension headings are in the row position.
- Blue headings are in the column position.
- Grey headings at the top are not currently in the table.
- Black highlights whichever dimension is currently selected, or the active dimension.
- You can drag dimensions around to put them where you want.
- Beyond 20/20 lets you stack several dimensions in columns, but only allows one dimension for rows.
Let's look at the average number of children in different areas of B.C.
Drag geography to rows
- Select Geography and drag it into the row heading
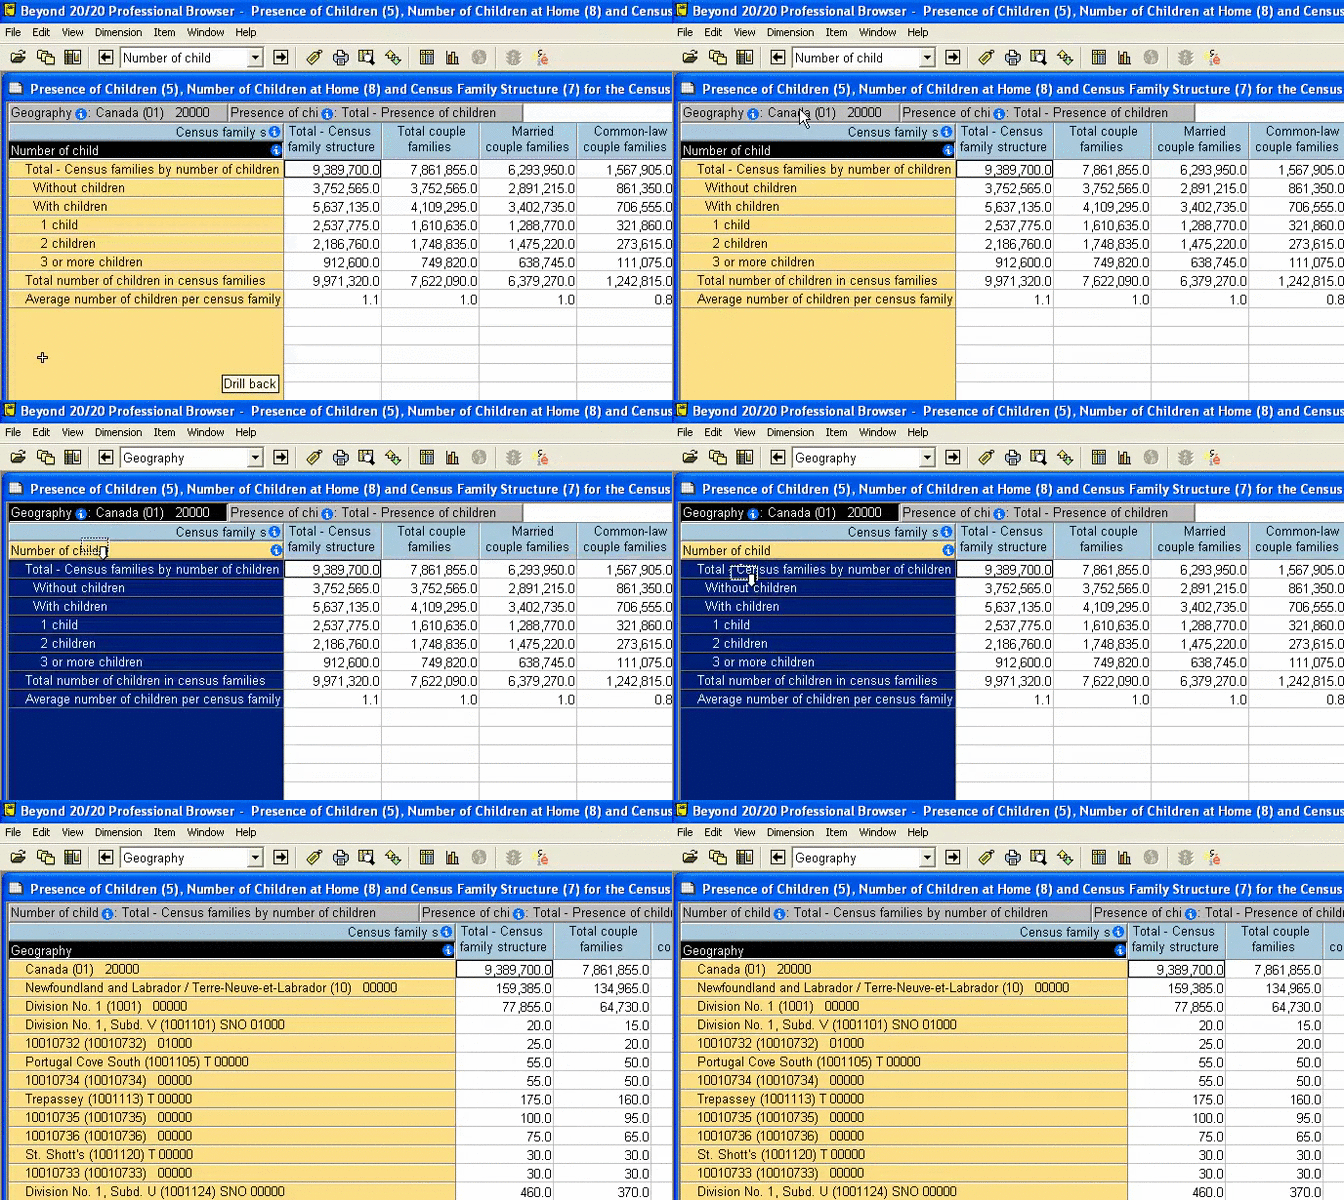
Drag the Number of Child dimension into the column heading area. It will switch places with the dimension that is currently there. If you end up with too many dimensions in your table, you can drag unwanted dimensions into the white bar at the top.
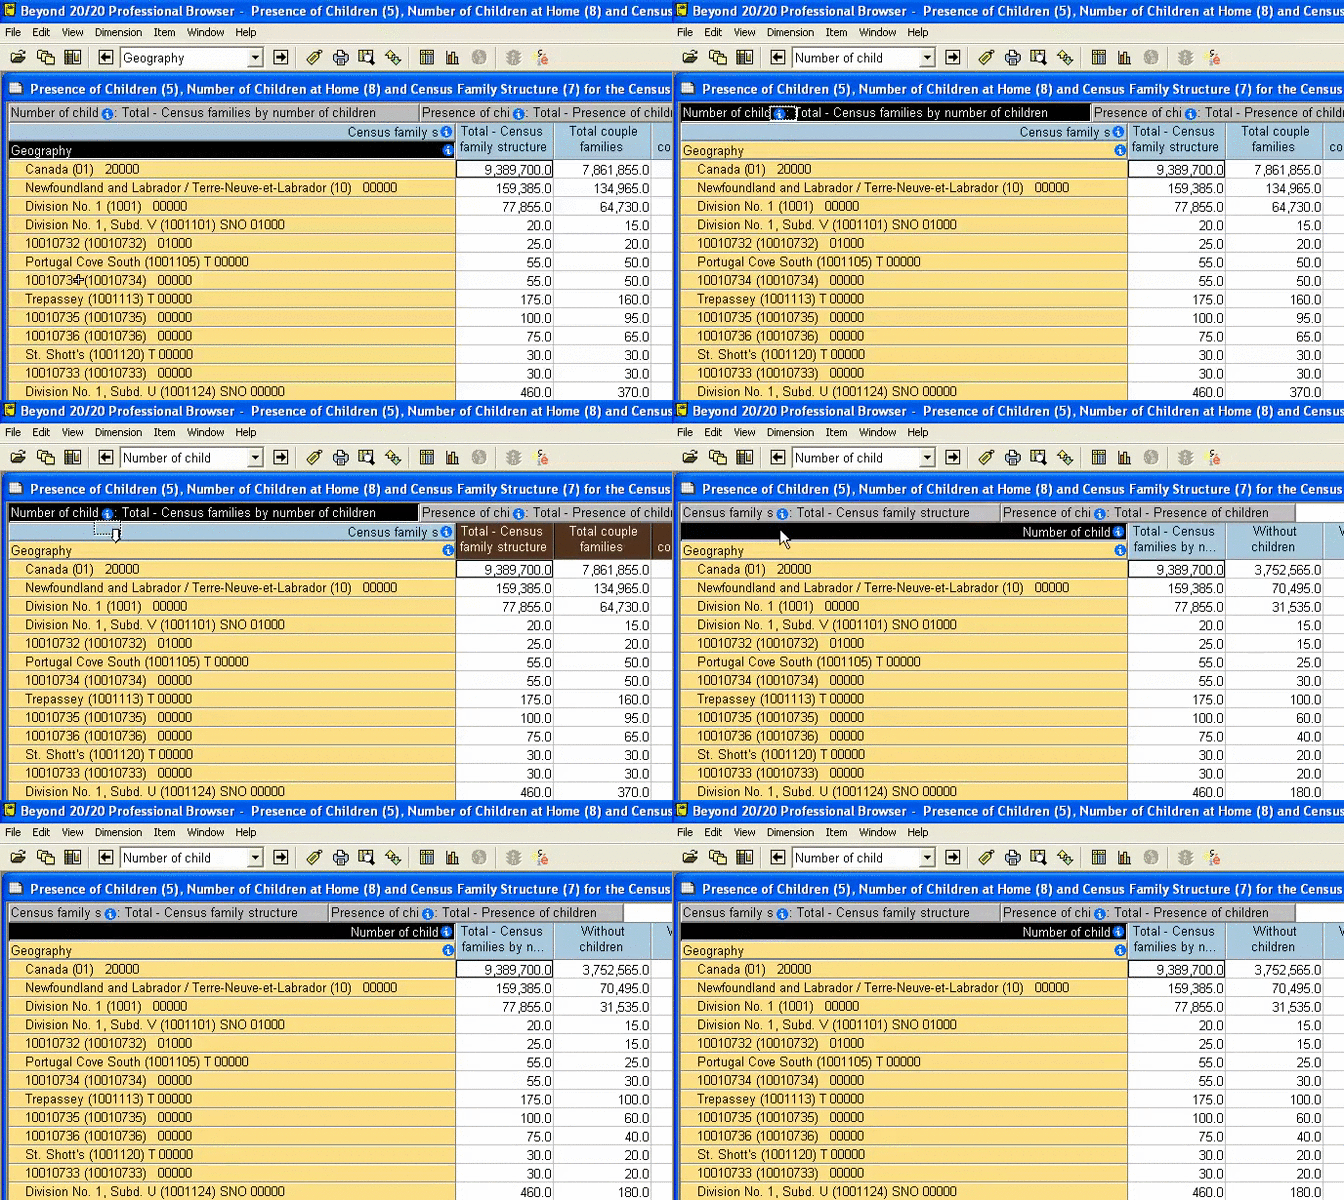
Select
The table still contains lots of data that isn't of interest. We can limit the table to show only those items we are interested in.
Limit Columns
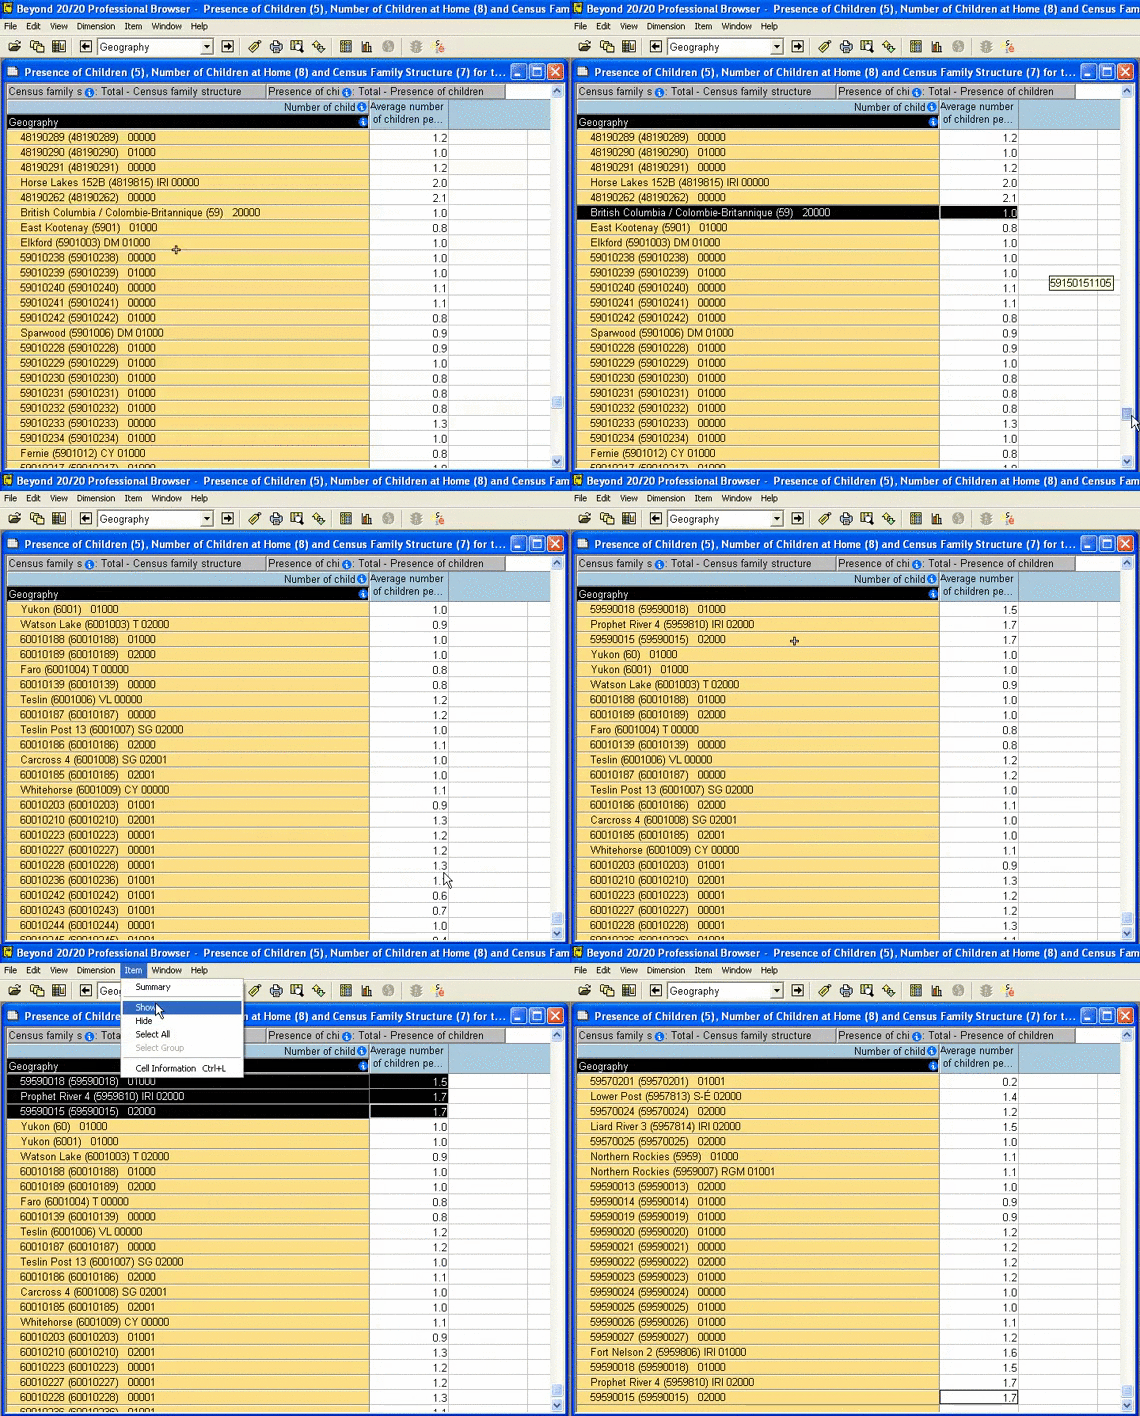
- Select the average number of children column, right-click, and select Show
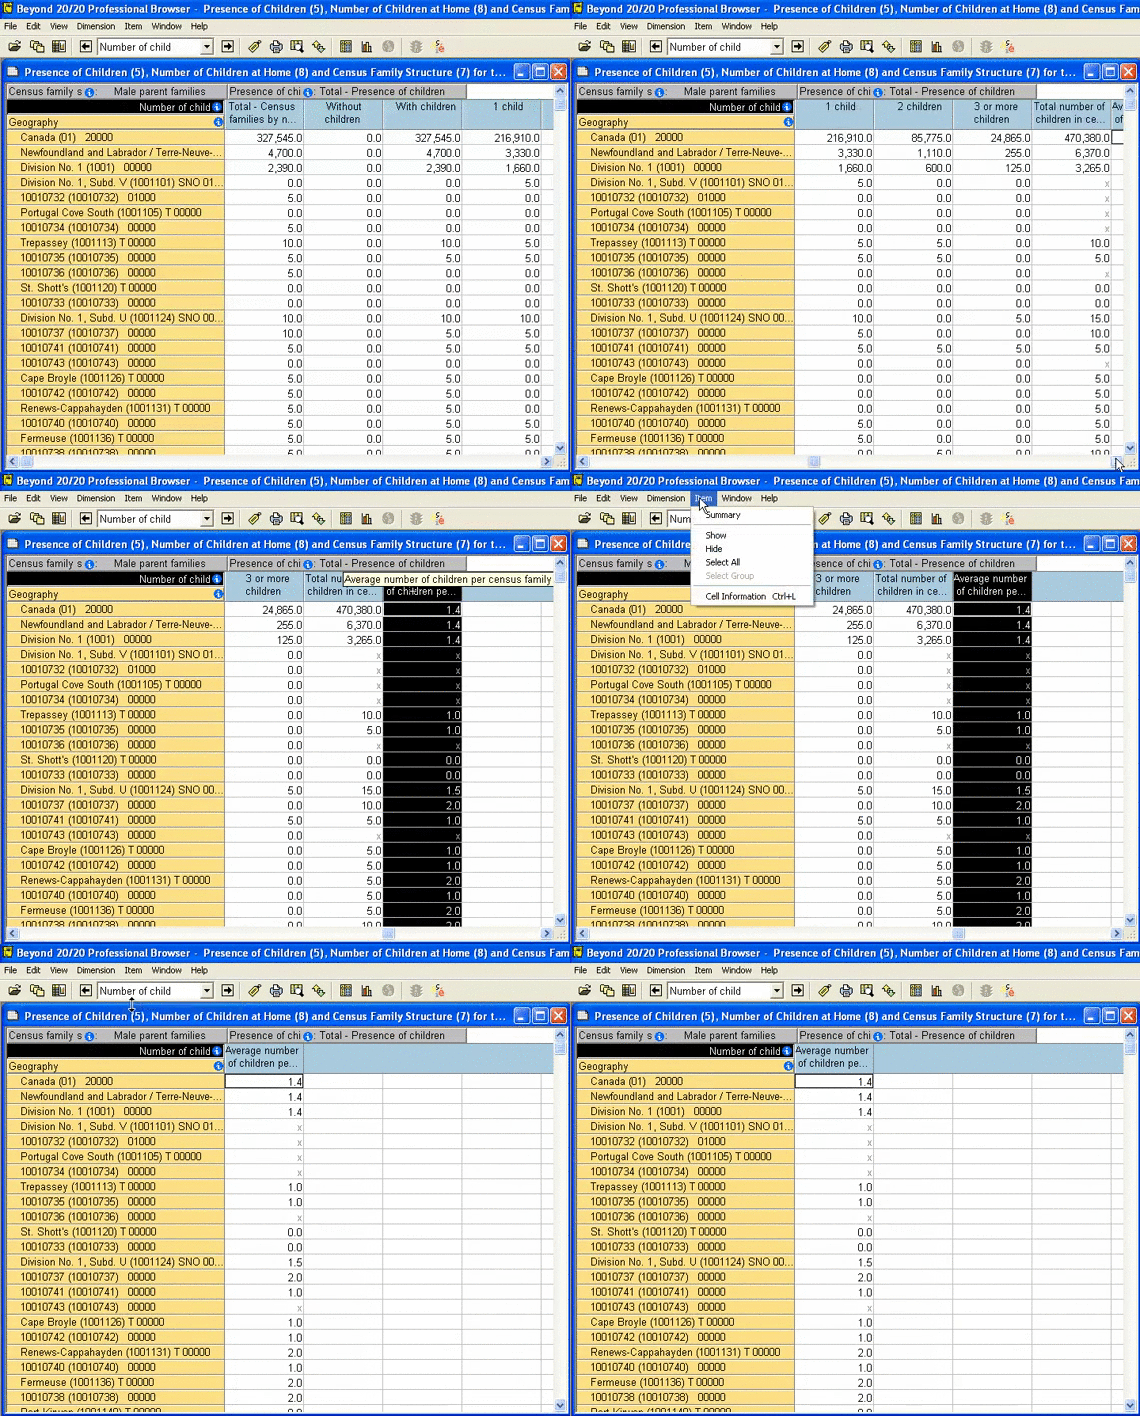
- If you are interested in more than one column, hold down CTRL while you select items. To choose a whole range of items, hold down SHIFT while you select the first and the last item.
Limit Rows
- To select all the BC rows (those beginning with 59), click on the first one (British Columbia), scroll down to the last entry (just before Yukon Territory), hold down SHIFT and click that last entry. Open the Item menu, and select Show
Labels
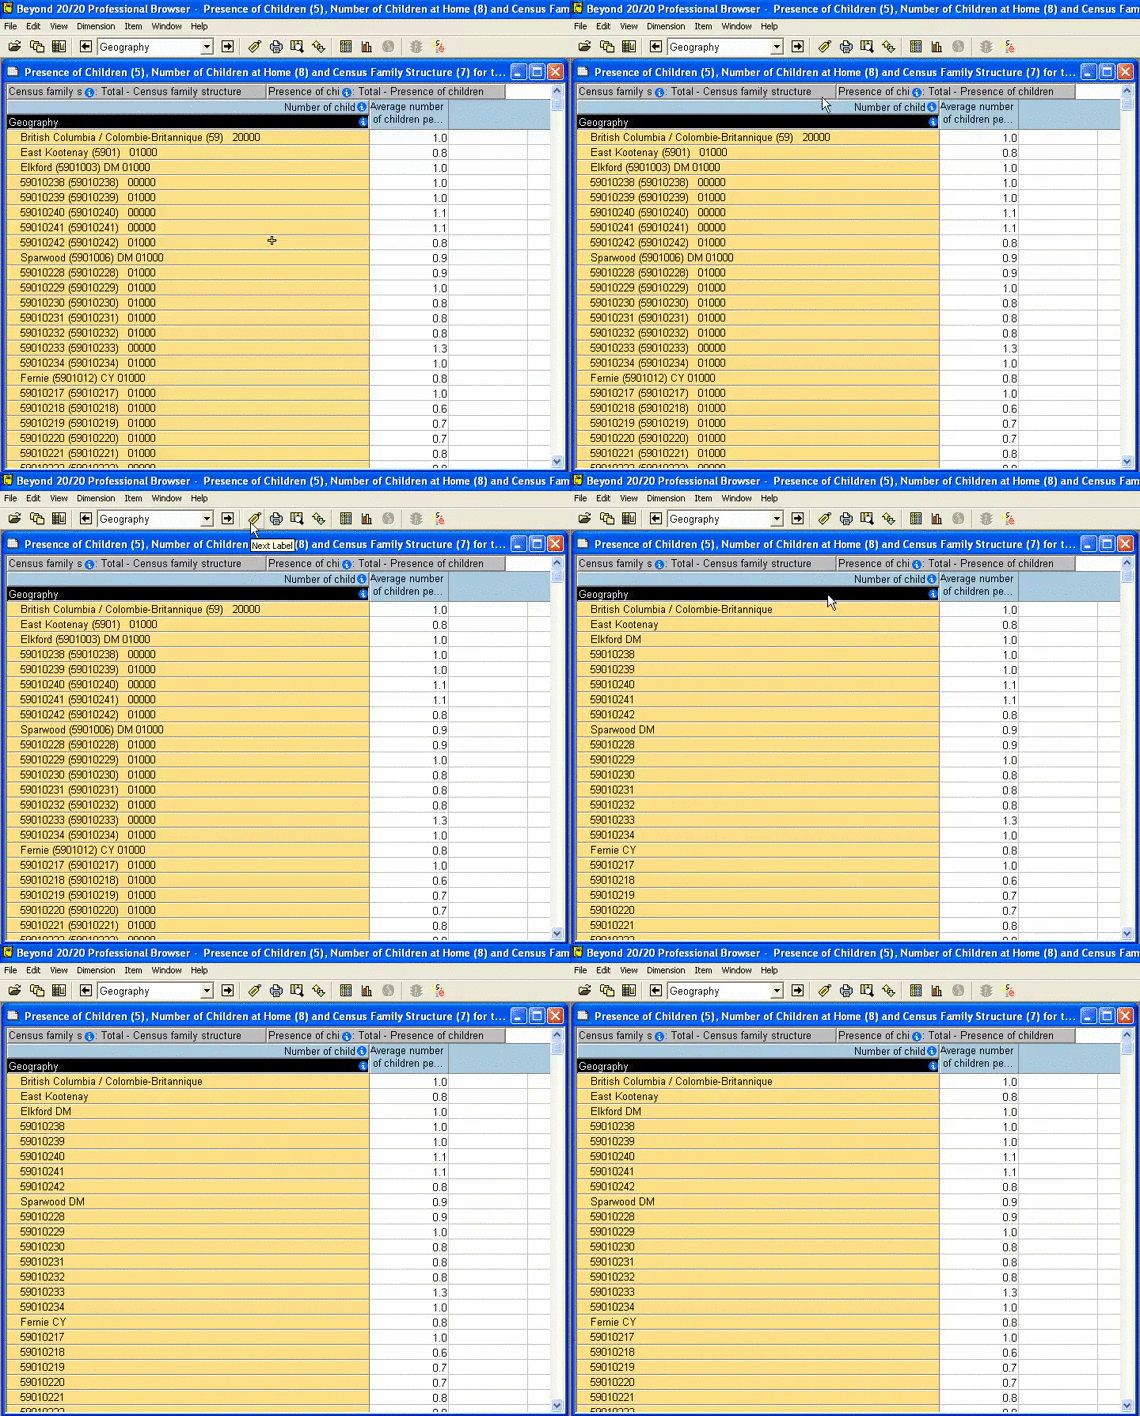
- Click the Next Label button once so that the dissemination areas are showing only their 8-digit codes and the larger regions display their names.
- The shapefiles will join with these 8-digit codes, so this is what we'll need to have showing in order to proceed.
Format
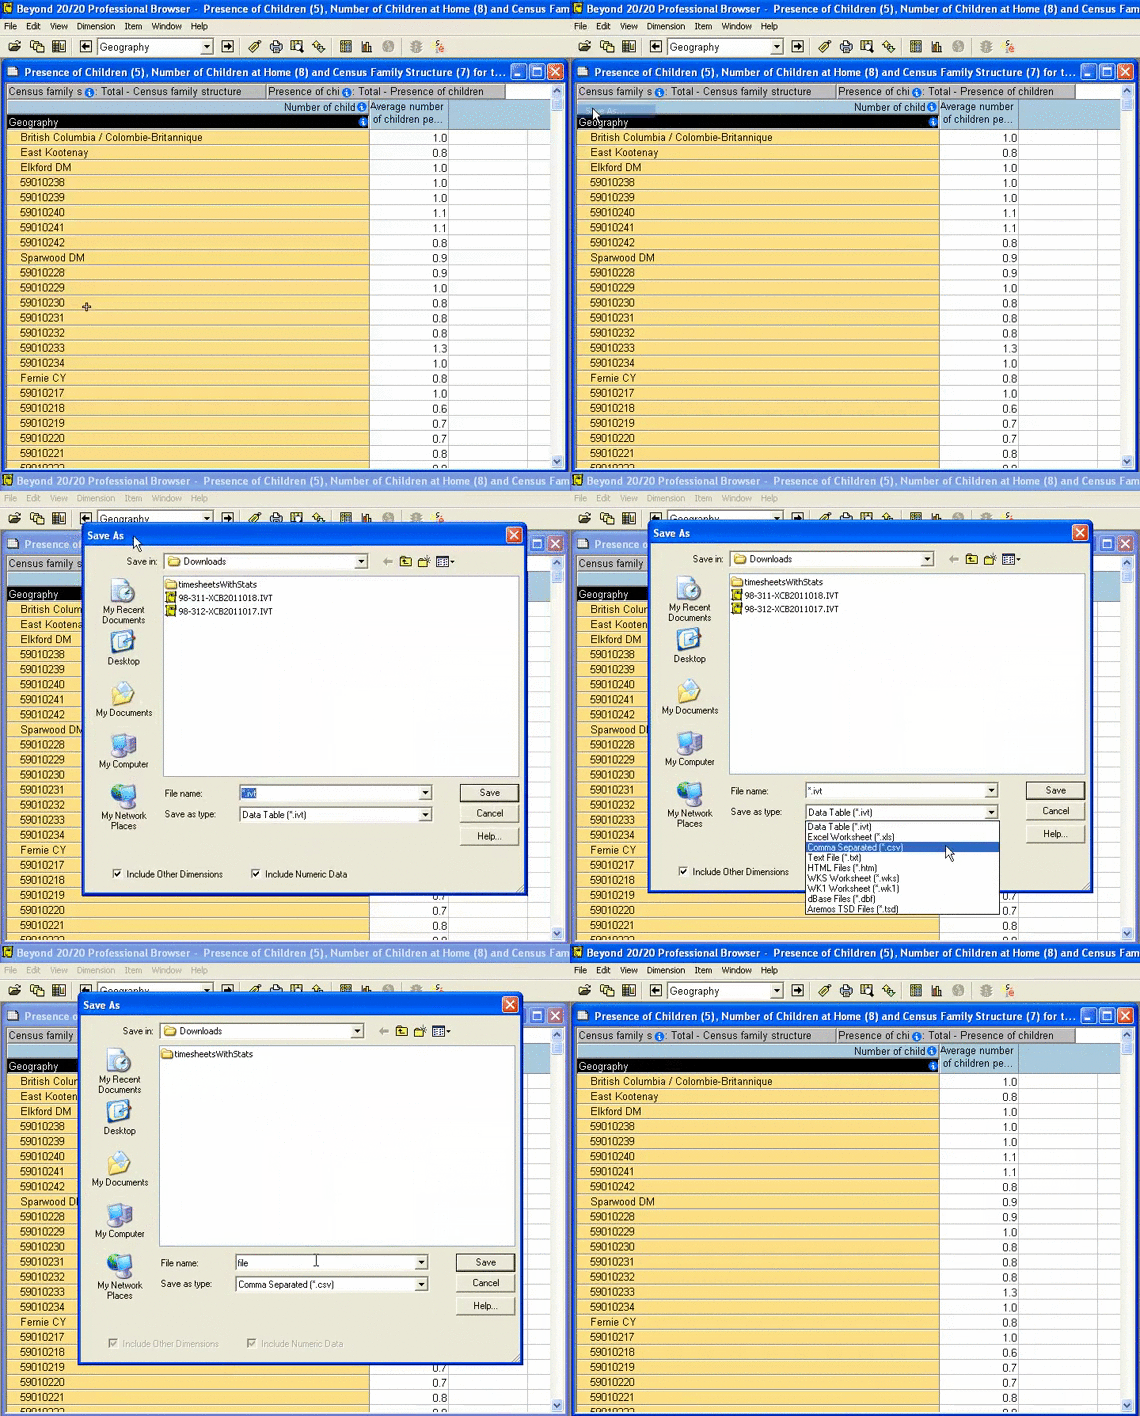
- Save the file in the .csv format.
- Open the file in Excel
- You will need to format the dissemination area codes as text.
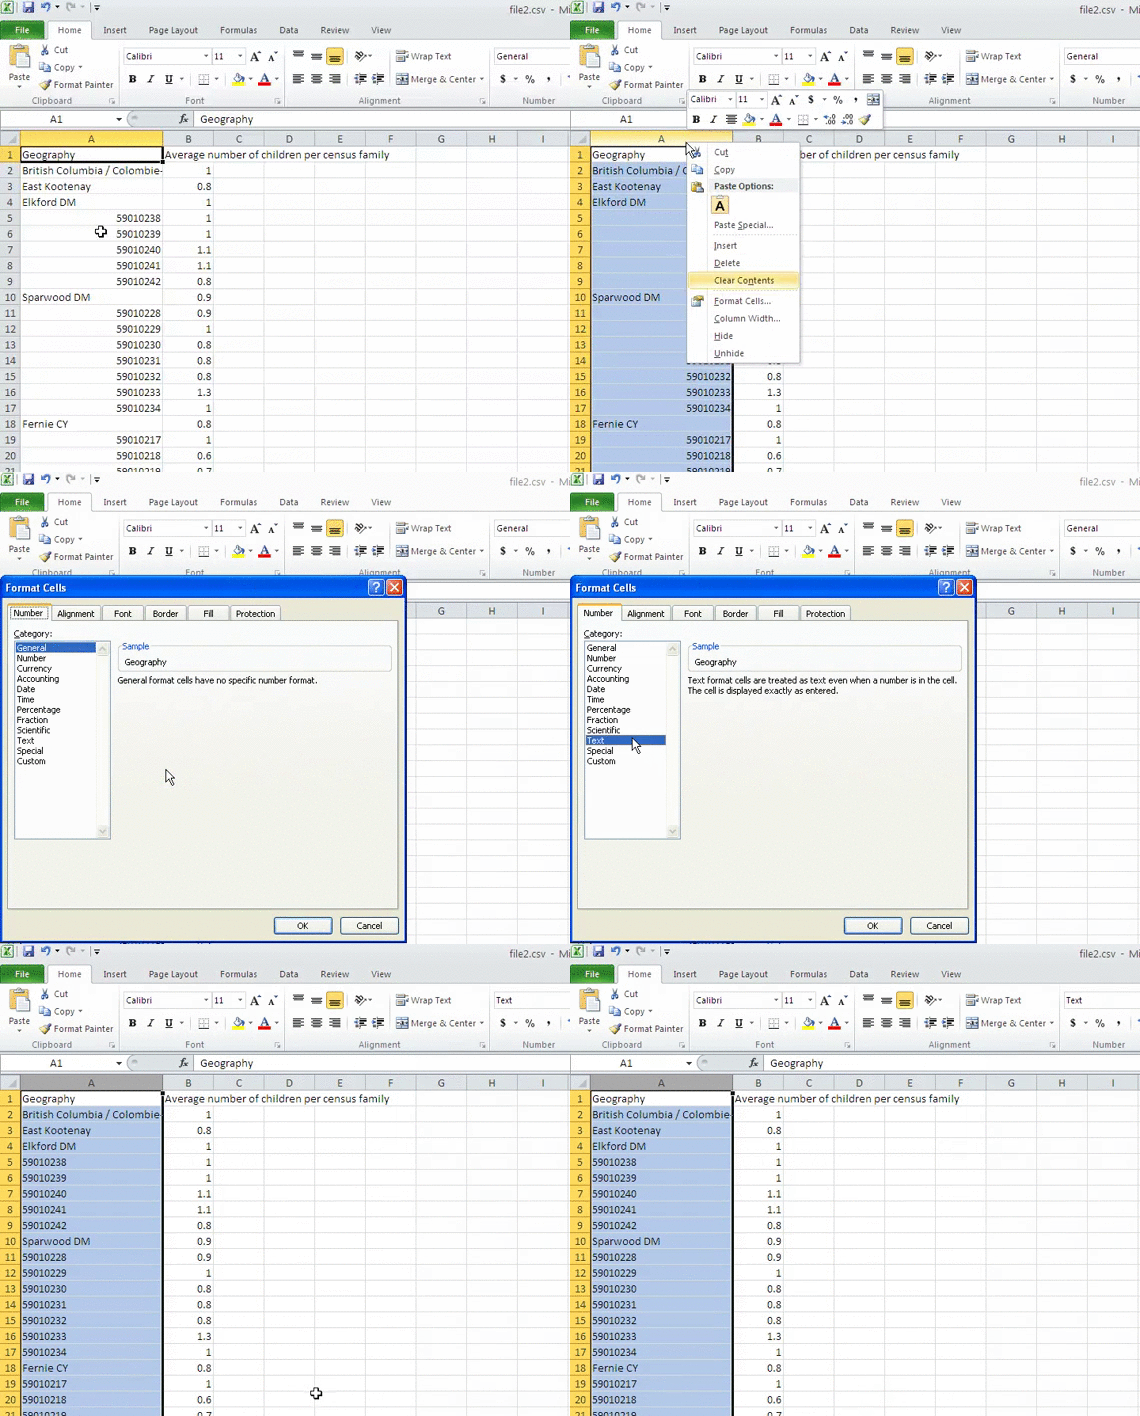
- Select the column with the codes and right click.
- Choose the Format Cells option from the menu.
- From the list of Categories, choose text, and click Ok.
- Now save the file in Excel format.
Unfortunately, the CSV saves the dissemination area codes as numbers, but the equivalent codes in the geometry file (which we’ll get to) are text. The two files will not join properly unless they are both of the same type.
Join
You will need to find the shapefiles in Abacus to join to the table you just made.
- Search for Cartographic Boundary File in Abacus, and choose the appropriate year. In this case, it's the 2011 file:
- Select the Dissemination Area file in the Data & Analysis tab.
- Save the file to a location and unzip it. This is a polygon shapefile.
- In ArcMap, the polygon shapefile field “DAUID” can then be joined to the Excel table’s field “Geography”.
If you need more information about how to join tables in ArcGIS, use this tutorial.
