Library:Circle/Google Analytics for cIRcle
Print me |
|---|
| Print this page |
Summary
This guide is an introduction to Google Analytics, specifically for the cIRcle site. Google Analytics tracks all kinds of information on visitors to the cIRcle domain circle.ubc.ca/. However it does not track file or bitstream downloads from cIRcle, and it does not distinguish communities, sub-communities, collections, and so on, because of it’s inability to understand hierarchical structures in DSpace. Still, Google Analytics is a very useful (and free!) tool to understand what visitors to cIRcle are actually looking for, and where they are coming from. Note that you will need to know the UBC Library cIRcle email and password for Google Analytics to be able to access the service.
Related Articles and Links
Reporting on cIRcle and doing assessment
Some basic dimensions in Google Analytics
Some basic metrics in Google Analytics
What is Google Analytics?
Google Analytics (GA) is a resource provided by Google that captures all kinds of information about visitors to your website, and then creates detailed tools to analyze all of this data. To set up GA, a small piece of code has to be added to each of your web pages. This code is in the header of the html for the page, and looks something like this:
When you get a visit to your site, the code is run and a message is sent back to Google with all kinds of information: the web browser being used and its language settings, the internet service provider and its location, how long the visitor spends on the page or on the site, where they click on the web page, which websites they are coming from, and a myriad of other interesting facts. The code doesn’t capture the name of the person related to the IP address, or any other possibly private information.
Types of measurements
Every measurement that GA takes is called either a metric or a dimension.
Metrics
Metrics are typically numerical measurements that can be analyzed statistically. They can be added or subtracted, and we can calculate average values, for example. In the context of a typical database or Excel spreadsheet, they would form the column headings and would be called ‘attributes’ or ‘measures’. Some of the more common metrics in GA are Visits, Visitors, Pageviews, Pages/Visit, Average Visit Duration, and the Bounce Rate. For more details on what these metrics are, and for some examples, please see the Google Analytics metrics page.
Dimensions
Dimensions are typically descriptive elements or categories that the numerical data can be grouped into. Often, the dimension values themselves are not numerical and so they cannot be added or subtracted, and we cannot calculate their average. For example, a dimension could be the country where the visitor is coming from, or the language of their web browser. Values for these two dimensions could be Canada, Egypt, Australia, and so on; and English, French, Chinese, and so on, respectively. Notice that we cannot calculate an average country or an average language. In the context of a typical database or Excel spreadsheet, dimensions would form the row headings. For more details on what these dimensions are, and for some examples, please see the Google Analytics dimensions page.
An overview of the GA page layout
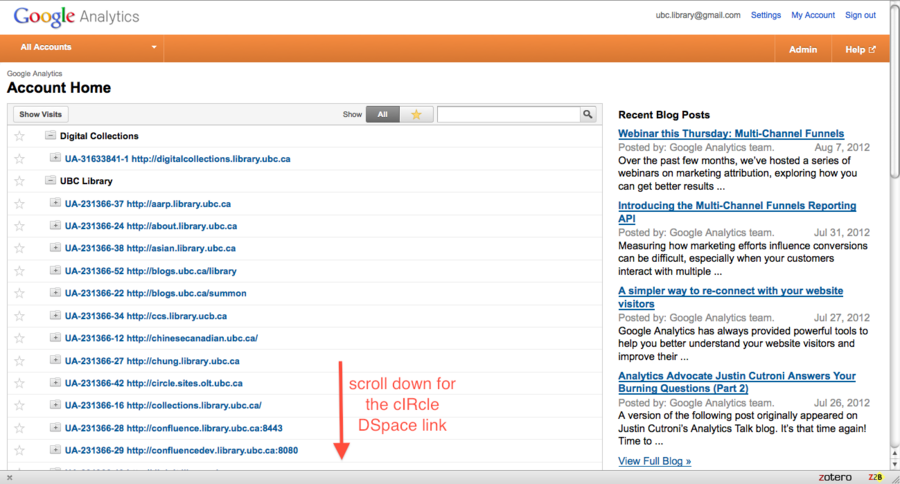
To access the UBC Library Google Analytics account, go to http://www.google.com/analytics/. After logging in with the email and password for the UBC Library GA account, we see a whole list of library websites associated with this account.
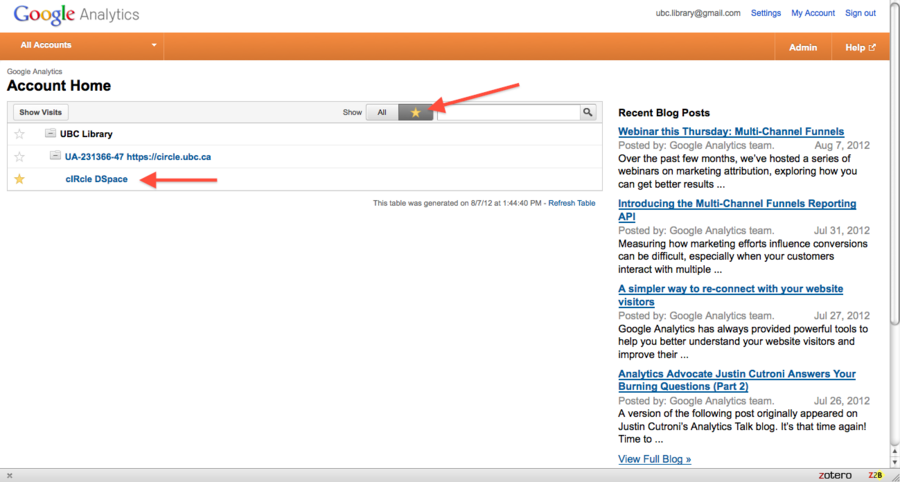
The one we want to select is called cIRcle DSpace and is listed under UBC Library, in the folder named UA-231366-47 https://circle.ubc.ca, which is right at the bottom. To get to this link more easily in future, we can also 'bookmark' it by clicking the star icon next to its name. The next time we want to get to the cIRcle DSpace link quickly, simply click the star icon in the menu bar at the top of the list of sites.
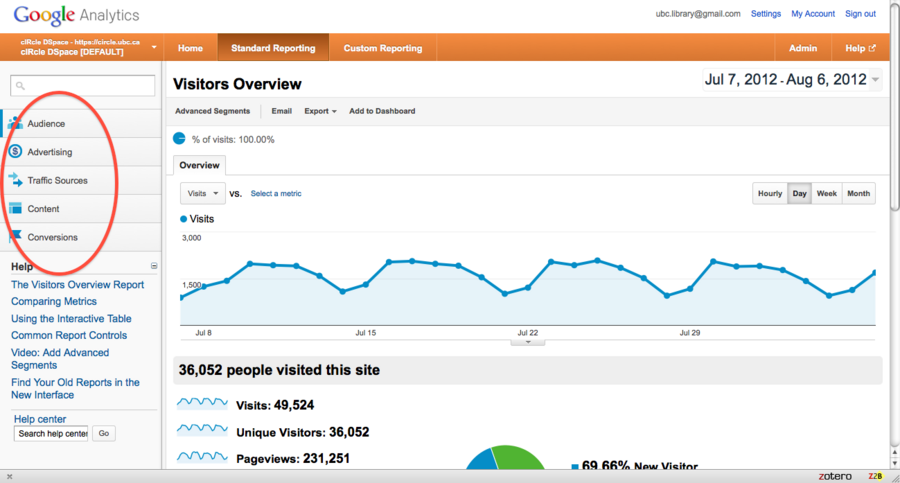
Once we choose the cIRcle DSpace Analytics link, we come to the following main page. There are three main spaces available, and they are listed across the orange menu bar almost at the top of the page: Home, Standard Reporting, and Custom Reporting. The Home space contains Dashboards that we create, and these contain summaries of different reports in compact widgets. For more on the Dashboards, please skip to the section on the Home space. The Custom Reporting space is the place for all the particular reports that we put together, and more on this can be found below.
Standard Reporting
For now, let’s look at the Standard Reporting section first. There are five main categories of reports listed on the left of the screen: Audience, Advertising, Traffic Sources, Content, and Conversions. Of these, only the Audience, Traffic Sources, and Content categories are useful for cIRcle.
Each of these categories comes with several reports already constructed, organized into themes that provide information that is commonly useful for tracking activity on our cIRcle site. The Audience category, for example, has themes named Demographics, Behaviour, Technology, Mobile, and Visitors Flow.
Audience
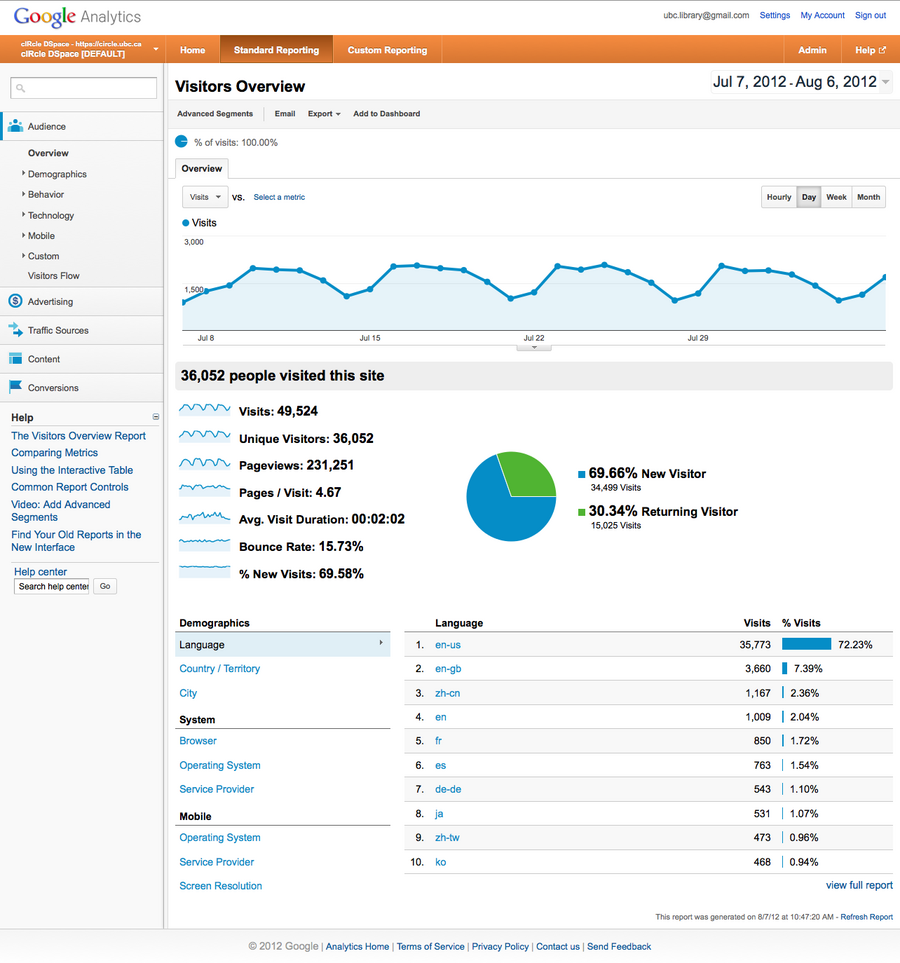
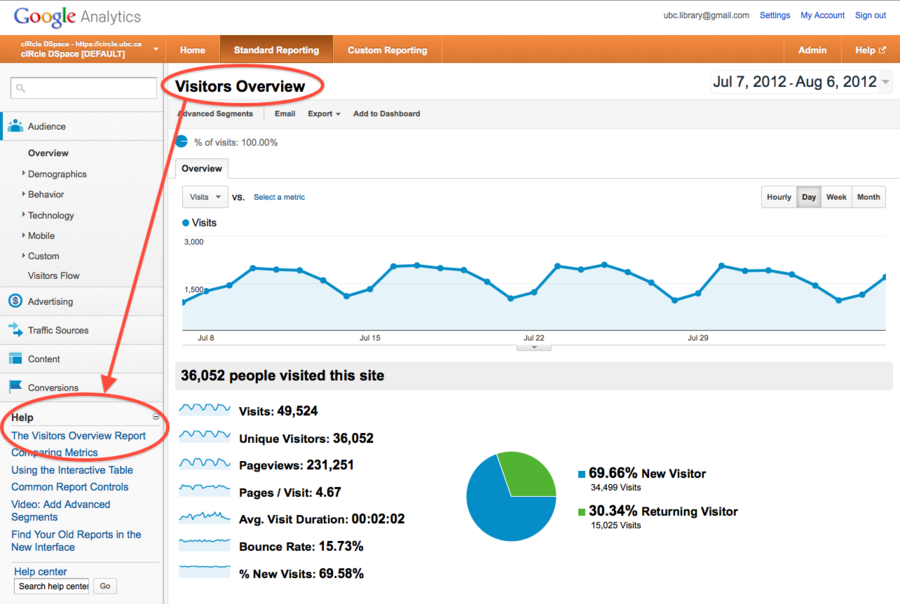
The collection of reports in the Audience category can help us to understand the geographical and social reach of cIRcle, to see where visitors are coming from, on the local, national and global levels. Clicking any of the themes in the Audience category displays a drop-down menu of reports contained within that theme. There is also a section for customized reports that we can create, using self-defined metrics.
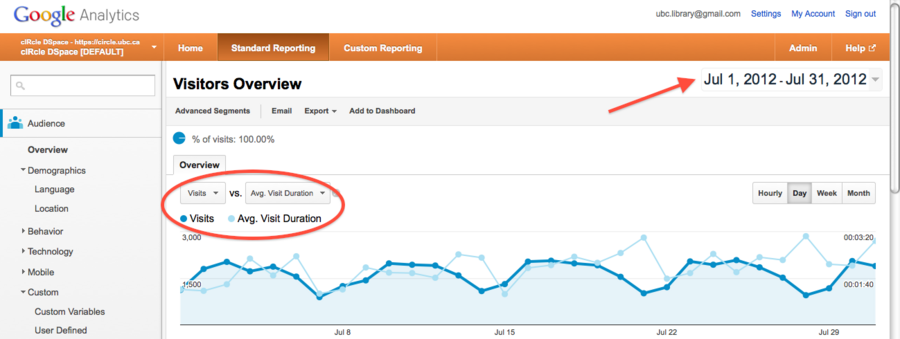
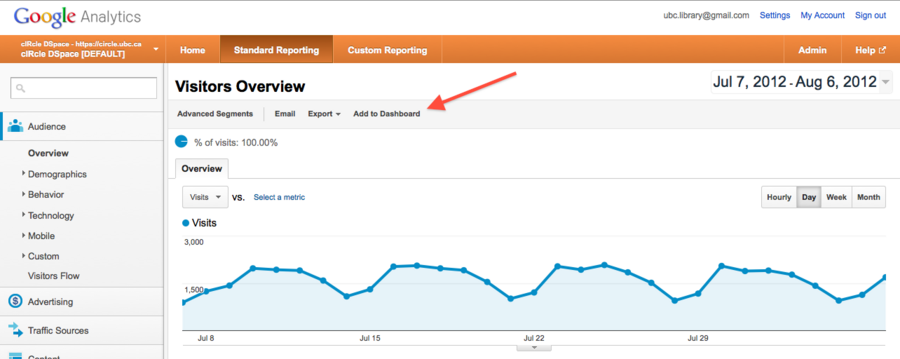
When we first click on the Audience category, we get an overview of information about visitors to the cIRcle site. At the top, there is a graph that displays the number of visits over time, but in fact we can plot any two metrics over a chosen time period. Note that these metrics have to be meaningful in the context of visitors to our site. The date range can be changed at the top right of the screen. Analytics for the cIRcle site was only activated on March 27th, 2012, and so including dates before that can lead to erroneous statistics.
Selecting any of the other themes such as Demographics, Behaviour, Technology, and so on gives lists of more detailed reports on measures such as the languages used, the location of the visitor, their browser type, their network and internet service provider, the duration of their visit, how many are new visitors and how many are returning, and so on. Most of these are generally self-evident measures, but if you need help of making sense of any of them, the Help menu at the bottom of the categories on the left side of the screen dynamically changes to give links to relevant help pages.
Traffic Sources
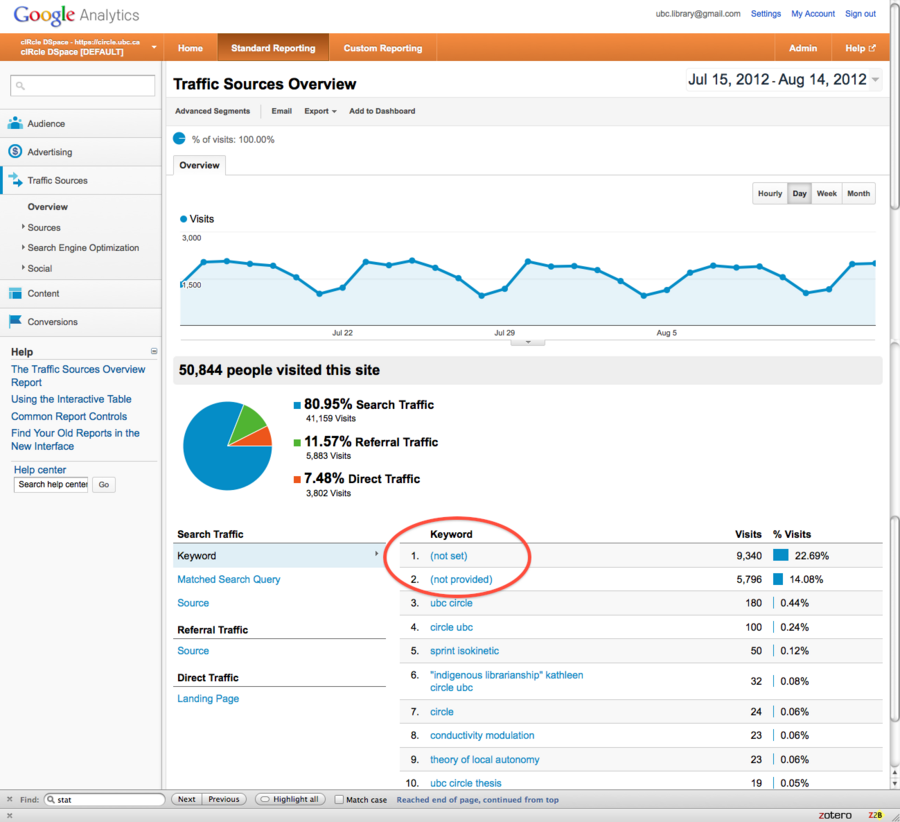
The Traffic Sources category has themes named Sources, Search Engine Optimization, and Social. As before, clicking any of these themes displays a drop-down menu of reports contained within that theme. A Traffic Sources overview gives information on how the visitors came to cIRcle, whether they arrived via organic search queries, by referral from another site, or directly (by book-marking the site or typing in the address). It also gives a list of the top ten keywords used in organic searches, as well as the different sources of these keywords: that is, the search engines used. You will probably find that the largest proportion of keywords is either (not set) or (not provided). This is unfortunate from the point of view of understanding our users, but is a result of either technical errors and glitches in the Analytics code, or of the privacy settings of individual visitors, respectively.
The other themes in the Traffic Sources category give more details on where traffic to cIRcle is coming from, whether by referral (from Google Scholar, or Wikipedia, or even Facebook and Twitter, for example), or by search engines, such as Google, Yahoo! or Bing. The keywords or phrases used in such searches are also provided. The Search Engine Optimization theme has reports on how many times pages from cIRcle that appeared in search results on Google were actually viewed by users (these are called impressions), how many times these results were clicked on by visitors, and the clickthrough rate or CTR, which is the percentage of impressions that led to visitors clicking through to cIRcle pages. In a sense, the CTR is one measure of the success of the optimization of cIRcle for search engines. The tally of impressions and clickthroughs can also be analyzed geographically, as well as by individual pages in cIRcle. More specifically, the CTR can be calculated for cIRcle pages that visitors first land on.
Content
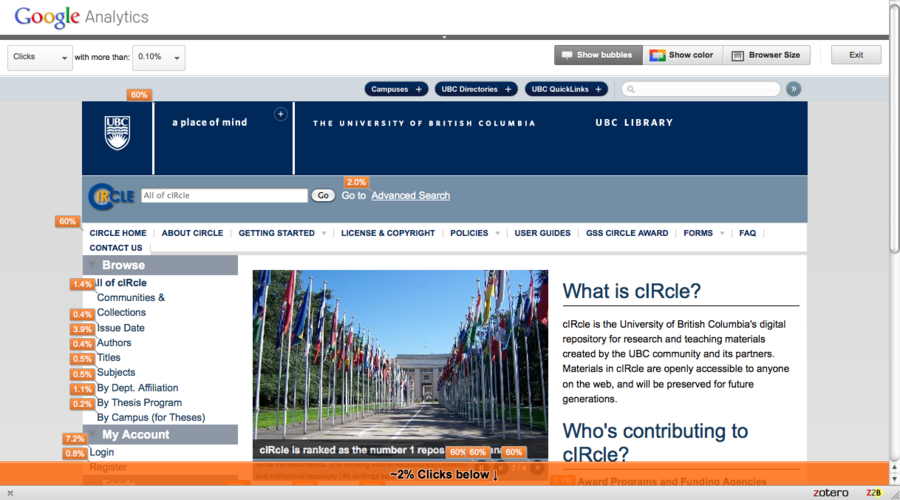
Finally, the Content category has several themes. Some are again not relevant to cIRcle, because they involve advertising or the measurement of 'events', that is, certain actions that visitors might be taking that we want to track. However, we could identify bitstream downloads as events, in which case we would be able to track file downloads through Google Analytics. There is also a Site Search theme which is not turned on for cIRcle since we don't rely on Google for our searches internal to cIRcle. The remaining useful themes are named Site Content, Site Speed, and the remarkable In-Page Analytics. This theme contains a report that shows how visitors interact with every one of the web pages in cIRcle. That is, for any link on the page, you can see the percentage of all page clicks that happened on that link.
It's important to note that you can see these percentages only for links on a page that lead to other cIRcle web pages. Also, you cannot see these percentages for links that lead directly to pdf files, or to other direct downloads with no page associated to them. Often you will notice that the percentages of clicks on a page add to up to more than 100%; this is not an error, but simply due to the fact that there could be many different links on a page that actually lead to the same place. For example, notice that in the image above, there are several links with '60%' associated to them: a place of mind (at the top), cIRcle Home (under the search box), as well as a number of items under the picture. All of these links lead to the same place, namely circle.ubc.ca/. In fact, all links that lead to the same page will have exactly the same percentage associated with them. Another nice feature is that once your In-Page Analytics is turned on, you will see the percentages of clicks on any cIRcle page that you navigate to, even if it's in another tab or browser window.
The Content category can also be used to give a detailed description of what pages visitors first landed on in the cIRcle domain. This could be useful for serials and journals, or even for other general collections that are in cIRcle. We could understand how visitors are accessing the content in that journal or collection, and perhaps adjust publicity for that content accordingly.
Custom Reporting
| This article is still being drafted. This means that the article is still being worked on and information may be incomplete. This template will be removed when the article is finished. If you have any concerns, please start a discussion on the talk page. |
For details on how to create a custom report, please see the short screen-cast video at ??. Note that you will need to already know how to sign in to Google Analytics, and what some of the more common metrics and dimensions represent. The video also briefly discusses how to create Advanced Segments, which can be applied across all reports, both standard and custom.
Home and dashboards
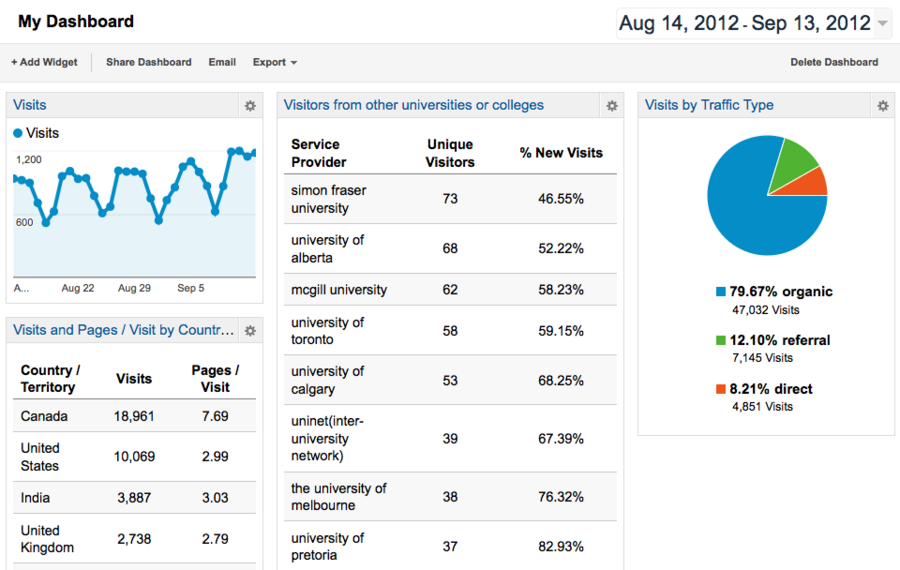
The Dashboard shows some key aspects of reports in compact condensed format, in the form of widgets. You can create widgets for most of the Standard Reports, as well as for any of the custom reports you have created. The idea is to be able to see, at a glance, some of the key performance indicators of your site. It's particularly useful to be able to export a dashboard to include when reporting to administrators. In fact, several dashboards can be constructed, each with it's own widgets that draw data from relevant reports.
On the report page, click the 'Add to Dashboard' button in the top menu bar. You will be asked to choose features of the report you want to include in the widget which will appear on the dashboard. It limits you to only three dimensions or metrics, and does not allow any drilling down into the dimensions. The functionality is limited, but in a sense this is the point, since the widget should only show key features that you can track quickly.
Exporting reports
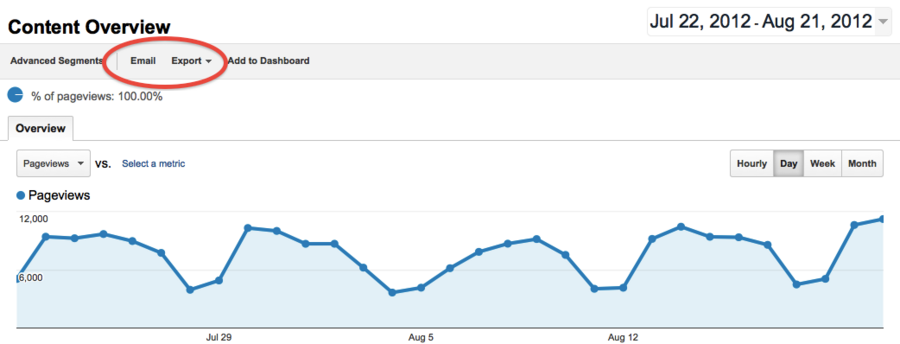
Both standard and custom reports can be exported to different file formats. In the menu bar under the title of the report being currently viewed, the Export drop-down menu gives the types of file formats that can be selected.
Currently, the formats are CSV (comma-separated values), TSV (tab-separated values), and PDF. The PDF file exported consists of a single- or multi-page layout of the report as it looks on screen. The CSV and TSV file formats are in table form, suitable for use with Excel, for example. Note that you cannot export the entire contents of the report; after all, some reports contain more than 10,000 rows! Only the first 500 or so rows of the report get included.
Next to the Export button, the Email button opens a menu where you can set up regular emails to be sent with appropriate reports attached. These emails can also be scheduled daily, weekly, monthly, or quarterly.
Conclusion
Google Analytics is an extremely useful service that can be used to analyze several aspects of external traffic to cIRcle content. It's features are evolving and therefore some points discussed here may not be relevant in future versions of Analytics. GA can also be a rabbit-hole, in the sense that it is easy to fall into the volumes and volumes of data available to be studied, as well as the many reports available. It is probably best to create the reports most useful for cIRcle assessment, and then have them emailed to administrators regularly. In this way only the most valuable data can be extracted and used to report on cIRcle's evolution.
Any questions or feedback? Please contact us

