File:Gerrymander chart.png
Size of this preview: 800 × 422 pixels. Other resolution: 1,484 × 782 pixels.
Original file (1,484 × 782 pixels, file size: 398 KB, MIME type: image/png)
Summary
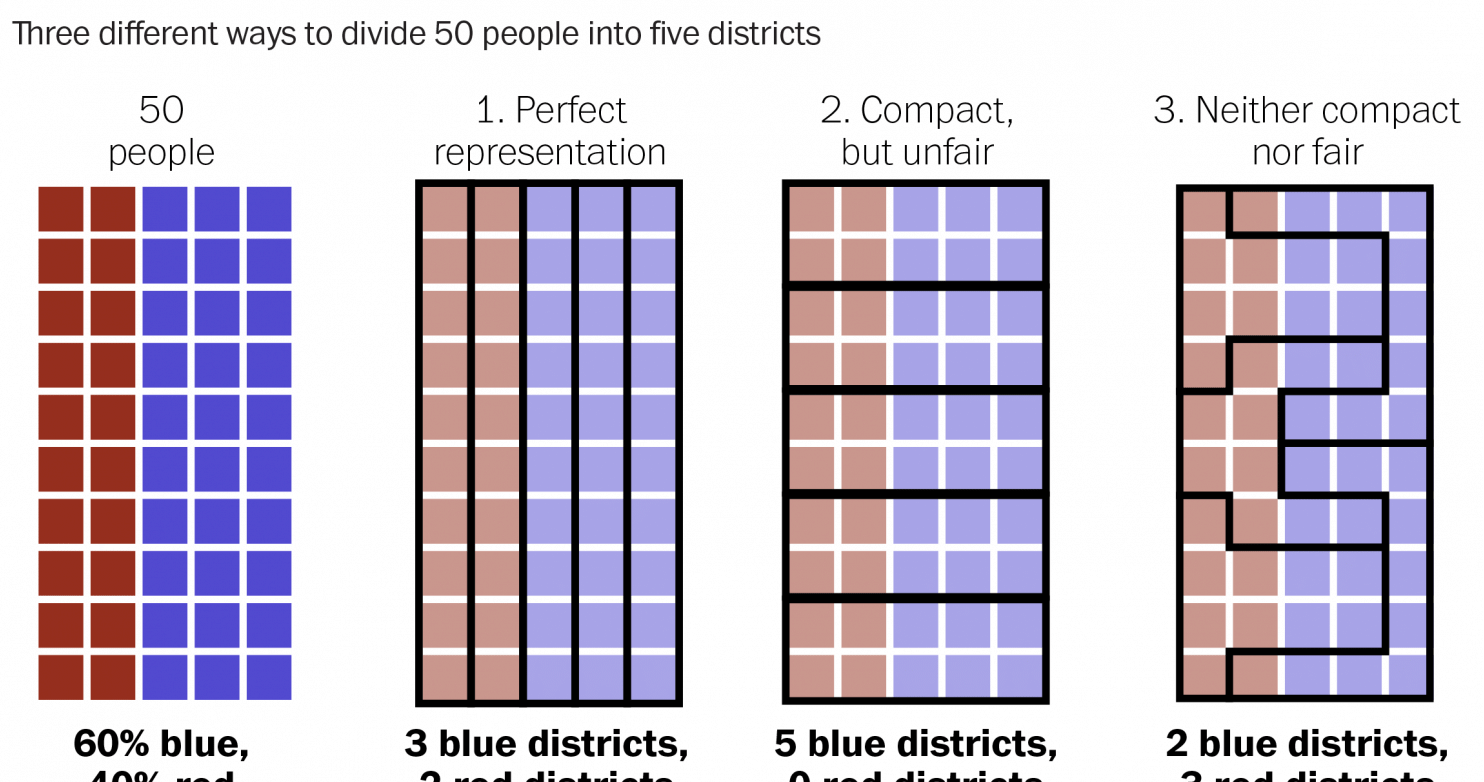
| Description | English: Washington Post chart visualizing gerrymandering process |
| Date | 1 August 2016 () |
| File source | https://www.washingtonpost.com/news/wonk/wp/2015/03/01/this-is-the-best-explanation-of-gerrymandering-you-will-ever-see/ |
| Author | Christopher Ingraham |
Licensing
{{subst:uwl}}
File history
Click on a date/time to view the file as it appeared at that time.
| Date/Time | Thumbnail | Dimensions | User | Comment | |
|---|---|---|---|---|---|
| current | 00:53, 2 August 2016 | | 1,484 × 782 (398 KB) | MaxMiller1 (talk | contribs) | User created page with UploadWizard |
You cannot overwrite this file.
File usage
The following page uses this file: