Documentation:Library/Circle/Public View Statistics
Public Statistics Reports in cIRcle
Print me |
|---|
| Print this page |
Summary
The University of British Columbia’s digital repository cIRcle has a variety of statistical tools and statistical reports available to help users analyze the content and usage of the repository. These reports can be broadly distinguished as two types: Public Reports and Administrative Reports. Public Reports are freely accessible to any cIRcle visitor, and Administrative reports are used by cIRcle members with administrative privileges. This user guide will introduce you to the Public Reports and teach you how to use them to learn more about cIRcle’s content and usage.
There are two types of public reports available to cIRcle visitors: statistical reports, and statlets. This user guide is an introduction to the public statistical reports, which include the Most Popular Items report, the Statistics by Country report, and the Country: Most Popular Items report.
These reports provide our visitors with an overview of just how many people are accessing cIRcle content (tens of thousands every month), and the breadth of our worldwide content dissemination. These reports can be used to learn quick facts about the repository, and to generate snapshots of the repository's use. They also act as starting points for exploring cIRcle by introducing visitors to content they might not have otherwise discovered, and introducing them to a new way of approaching navigating the repository.
Related Articles
For information about Public reports: Statlets, please visit the following link:
For information about Administrative Reports, please visit the following links:
Usage Statistics
Content Statistics
Search Statistics
Storage Statistics
Workflow Statistics
Accessing Public Reports
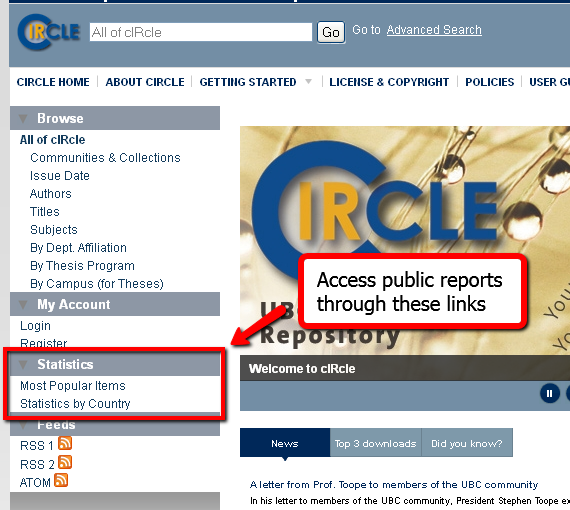
On cIRcle's homepage, there is a section titled Statistics in the left hand navigation bar. Two reports are available there: Most Popular Items and Statistics by Country. This guide will begin with Most Popular Items.
Most Popular Items Report
The Most Popular Items report is a list of the most popular items in cIRcle as determined by the consolidated amount of File Downloads (the number of times the item's content documents have been downloaded) and Abstract Views (the number of times the item's abstract page has been visited).
The report will generate automatically using the following defaults:
- 10 results
- Entire repository
- All regions
- Past year
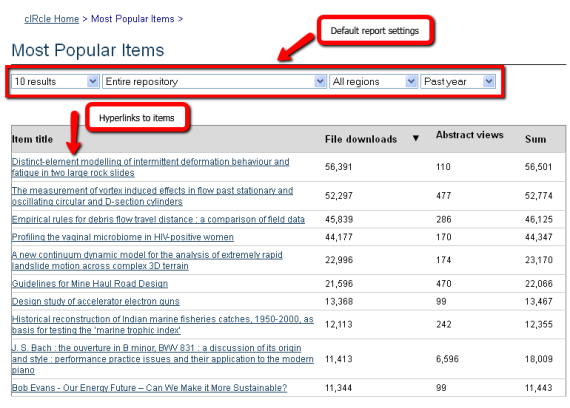
The report presents itself as a table listing Item title, followed by File downloads, Abstract views, and the sum of downloads and abstract views. The Item titles are all hyperlinked, and clicking on them will bring you to the record of that item, where you can learn more about the item and download its associated files.
Reading the Report
- File downloads represent how many times the files associated with the item in question have been downloaded from cIRcle. This is also called a bitstream download.
- Abstract views refers to the number of times an item’s individual record has been landed on, or viewed. The item record is the page you will see when you click on a hyperlinked item title. This is also called a page view.
- Sum is the total file downloads and abstract views added together.
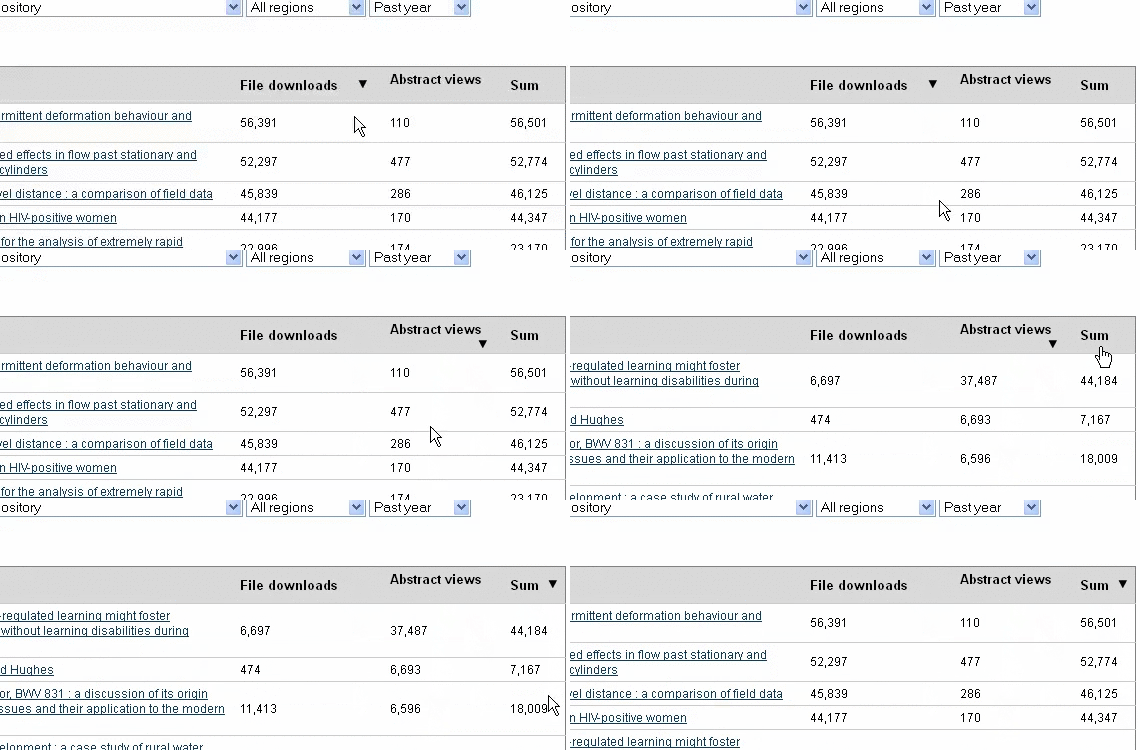
By clicking on the column heading of File downloads, Abstract views, or sum, you can change the sort order of the results. A black triangle beside the column title indicates the sorting column.
Underneath the table are two sums. The first is File downloads, total and the second is Abstract views, total. These numbers reflect the consolidated totals of downloads and views for every item contained within the scope selected in the drop down menus. If you are using the default settings, these totals will represent the entire repository. If the scope has been adjusted to a specific community or collection, this report will update to reflect that community or collection's totals.

Adjusting the Report
Using the drop down menus at the top of the table, you can manipulate the parameters of the report. Let's say we want to see the most popular items in the Chemistry community. We'll use the drop down menus to build the report.
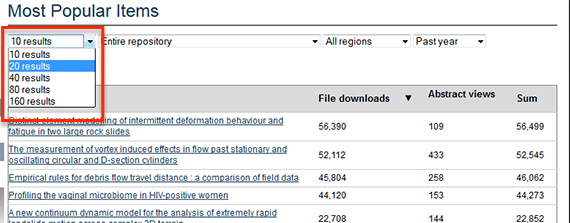
The first menu allows you to select the number of results displayed in the table. The default setting is 10 results but by clicking in the drop down arrow in the right side of the box, you can select 20, 40, 80 or 160 results. We expect there will be a lot of great items in the Chemistry collection, so let's select to view 20 results, which will allow us to see a bit more at a glance without overwhelming us.
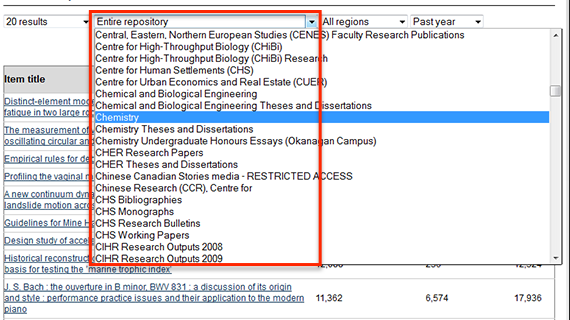
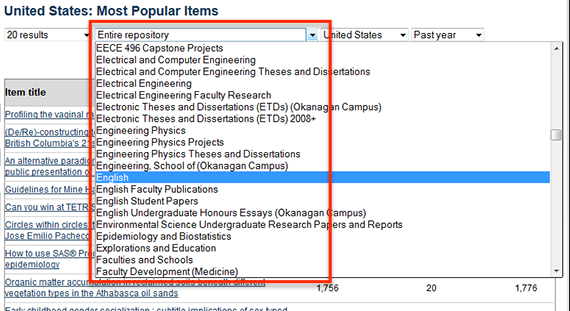
The second drop down box narrows the scope of the report. Its default setting is Entire repository, which means the results are being collected from cIRcle as a whole. The drop down menu provides a list of all the various collections and communities housed within cIRcle. By selecting one of these, our results will be limited to items that belong to that collection or community. Let's scroll down to "c" and select "chemistry."
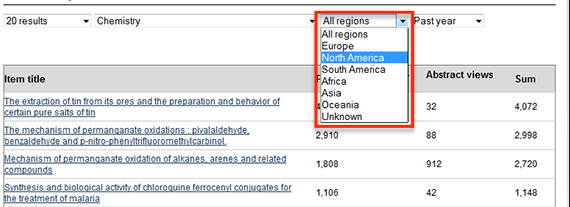
The third dropdown box allows you to break up the data geographically. cIRcle is visited by scholars and researchers from all over the world, and changing the region setting allows you to see what content is most frequently accessed from different continents. The default setting is All regions, meaning the report is consolidating all views, worldwide. If you click on the arrow on the right side of the box, you can select from the options: Europe, North America, South America, Africa, Asia, Oceania, or Unknown. Let's say, for our report, that we're really interested in seeing what materials are being accessed most frequently by North American scholars, so from this menu we will select North America.
The fourth and final drop box determines the time scope of the report. The default setting is to limit the report to data collected within the past year. Using the drop down menu, this time frame can be adjusted to All time, Past month, Past 3 Months, Past 6 months, Past year, or Custom. All Time will aggregate all of cIRcle's stored data, which dates back to April, 2009. Custom allows you to target specific periods of activity that may be relevant or significant to you, such as July 2011 to September 2012. Let's say that we're particularly interested in what's been happening in Chemistry research over the past six months. From the dropdown menu, select Past 6 months.
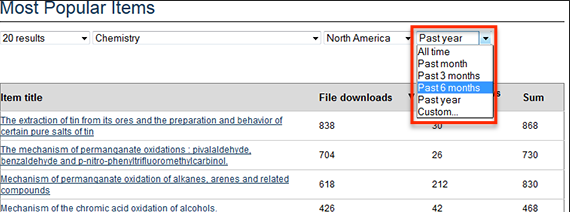
Every time you make an adjustment to the parameters of the report, the new report will self-generate automatically. Public reports are only available on the cIRcle website and cannot be exported.
The Usage Statistics reports in the Administrative Reporting Suite generate similar reports to the Most Popular Items report, and those reports can be exported. To learn more about that tool, please read the Usage Statistics User Guide. If you are not a cIRcle administrator but would like access to this report, please contact the cIRcle office for assistance.
Statistics by country
The Statistics by Country report is accessed through the left hand navigation by on cIRcle's homepage.

This report offers a snapshot of cIRcle's reach by tracking the country of origin associated with file downloads and abstract views. Like the Most Popular Item report, it displays as a table, and has several adjustable components.
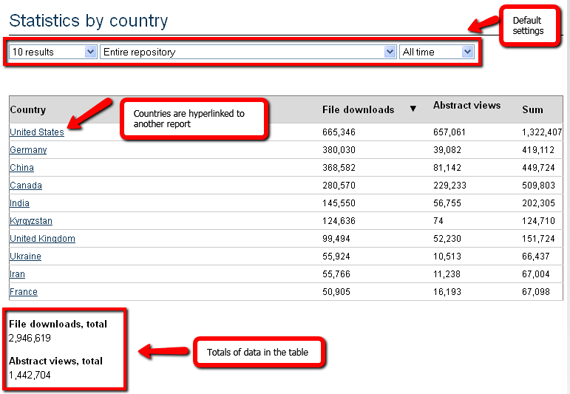
The table ranks countries based on the amount of file downloads, abstract views, or the sum of the two, that originated from that country. Like the Most Popular Item report, a black triangle indicates which parameter is the source of the ranking, and clicking on the column header will change the sorting column.
Underneath the table is a listing of the table’s totals, with File downloads, total and Abstract views, total.
The drop-down menus above the table allow you to modify the data being displayed.
The first menu is the amount of results listed in the table. The default setting is 10 results. By using the arrow in the right of the box, this can be adjusted to 20, 40, 80, or 120 results.

The second menu indicates the scope of the report. The default setting is Entire repository, which means that the results you are seeing include data from all cIRcle collections. Using the drop down menu, you can narrow the scope to specific communities or collections.
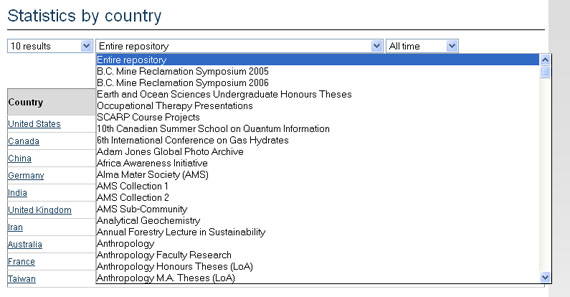
The final option is to adjust the time scope of the report. Its default setting is Past year, but it can be adjusted to All time, Past month, Past 3 months, Past 6 months, or Custom. By selecting Custom, you will be prompted to enter a specific date range.

Like the Most Popular Items report, the Statistics by country report dynamically reacts to reflect any changes in the report settings. There are no extra execution commands. Data from the table cannot be exported from cIRcle.
Country: Most Popular Items
A unique feature of the Statistics by country report is that the listed countries are all hyperlinked. Click on Statistics by country from the cIRcle homepage

From that report, click on the hyperlinked country names to reach a new report called Country: Most Popular Items.
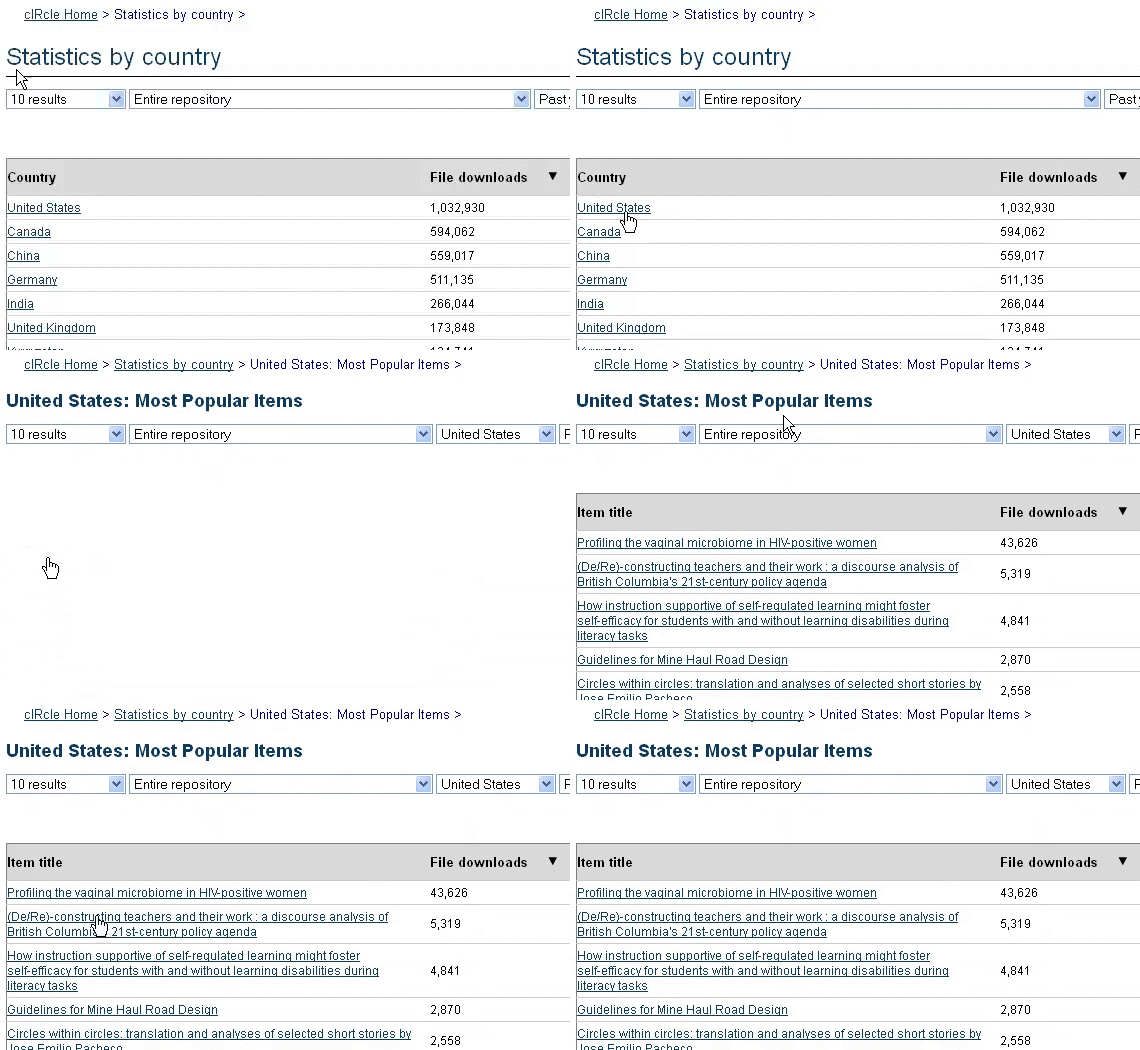
This report is a hybrid report between the data we saw in the Most Popular Items report and the data of the Statistics by country report. While the Most Popular Items report allows you to narrow the report by continent, the Country: Most Popular Items report drills down to a more refined level and aggregates item downloads and abstract views from specific countries.
The country being represented is visible in the title of the page, and can be altered in the drop down menus lining the top of the report. The default country is whatever country you clicked on in the Statistics by country report.
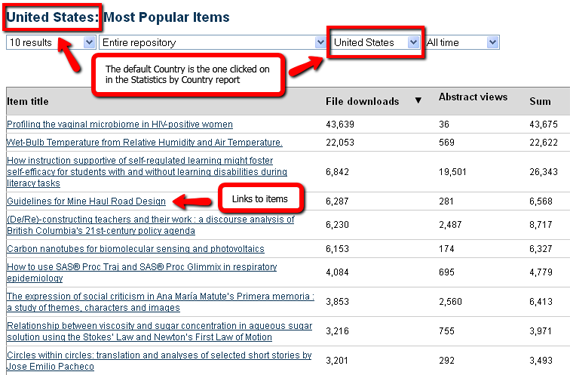
The table lists the hyperlinked titles of cIRcle items alongside their file download count, abstract view count, and download+views sum. A black arrow indicates which column is the sorting value, and that value can be changed by clicking on the column titles. Clicking on the hyperlinked item titles will bring you to the item’s full record within cIRcle. Underneath the table, you can see the consolidated sum of the number of file downloads represented in the table, and the sum of corresponding abstract views.
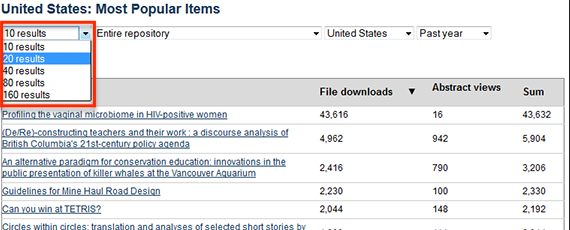
The report can be modified and manipulated using the drop down menus above the table. The first drop down menu indicates how many items will be included in the report. The default value is 10 results, but you can choose 20, 40, 80 or 120 results instead.
The second drop down menu indicates the scope of the report. The default setting is Entire Repository. By clicking the arrow in the right side of the box, you can choose to limit your report to a specific community or collection.
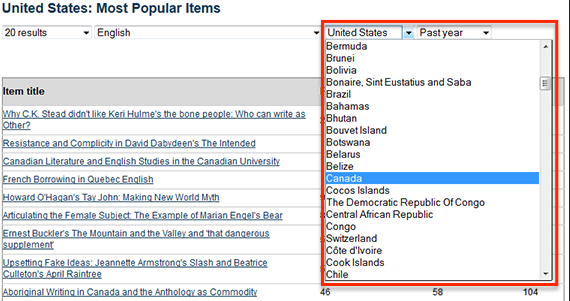
The third drop down menu is how you select the country whose data you wish to view. Its default value is the country that was selected in the Statistics by country report.
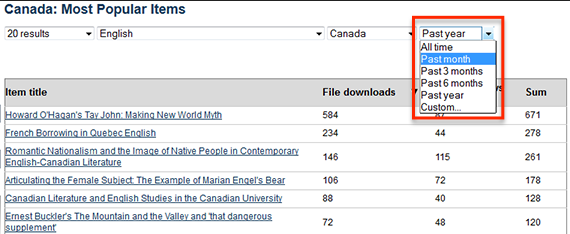
Finally, the fourth menu allows you to indicate the time span of the report. The default setting is Past Year, but this can be adjusted to All time, Past month, Past 3 months, Past 6 months, or Custom.
Like the other public reports, this report dynamically responds to parameter changes and does not require additional execution commands. The data in the report can only be viewed on cIRcle and is not available for export.